Deployment
M5 gives the deployment topology its own page; operations.adoc’s ` anchor now points here. The Helm chart at helm/ft-fcc-service/ carries its own exhaustive README.md with the full values reference — this page covers what an operator planning a deployment needs, and the reasoning the values table cannot carry, without duplicating it line for line.
|
The container’s port 8080 must never be published outside the docker network / cluster network. This service has no authentication of its own (No Authentication by Design); its only access control is that it is unreachable except from inside the network, where |
The Image
Multi-stage, multi-arch Dockerfile at the repository root.
The build stage is pinned to $BUILDPLATFORM — it always runs natively on whichever machine is doing the build, regardless of the target architecture. This is deliberate: the output of a Maven build is a JVM jar, which is architecture-independent, so running Maven under QEMU emulation for a foreign target would cost several minutes of wall clock per build for a byte-identical artifact. The runtime stage deliberately carries no --platform at all; docker buildx resolves it once per --platform entry in the manifest, so each architecture gets its own native eclipse-temurin:25-jre. Pinning the runtime stage to $BUILDPLATFORM as well — the "obvious" fix an unfamiliar reader might reach for — would put the builder’s own JRE into every architecture of the manifest, and the linux/arm64 image would silently be an amd64 one running under emulation.
The runtime image runs as non-root uid/gid 1000 (ftfcc), with -Djava.io.tmpdir=/tmp pinned explicitly on the entrypoint rather than left to the platform default — so the dependency on the /tmp emptyDir the chart mounts (Why /tmp Is Mounted, Specifically) is visible in the image itself, not only implied by the chart. The entrypoint also pins -XX:MaxRAMPercentage=65 (down from 75 as of the M5 review, MaxRAMPercentage Is 65, Not the More Usual 75).
|
A floating base tag broke this build, and the fix is in the Dockerfile now, not merely noted here. The Dockerfile now removes the conflicting Pinning both base images ( |
Building both architectures:
docker buildx create --name ft-multiarch --use   # once per machine

docker buildx build \
  --platform linux/amd64,linux/arm64 \
  --tag hub.friendly-tech.com/ftacs/ft-fcc-service:0.0.1-SNAPSHOT \
  --push \
  .
--push is not optional for a multi-platform build — the local Docker image store cannot hold a multi-arch manifest, so --load fails outright. To validate the file locally, build one architecture at a time: docker buildx build --platform linux/arm64 --load --tag ft-fcc-service:local .. .mvn/settings.xml is git-ignored (it carries registry credentials) but is copied by the build stage — create it from .mvn/settings.xml.template before building.
MaxRAMPercentage Is 65, Not the More Usual 75
The chart’s default resources.limits.memory is 1Gi, and the entrypoint reads it through -XX:MaxRAMPercentage=65 to size the heap: roughly a 665 MiB max heap, leaving about 360 MiB for everything outside it. At the more common 75%, that remainder was only about 256 MiB, and what has to fit in it here is not small — Spring Boot 3.5 metaspace plus code cache alone is commonly 150-220 MiB, and on top of that sit three Hikari pools, a lazily created ClickHouse pool, a Hazelcast client with its own IO threads and buffers, virtual-thread carrier stacks, and Liquibase plus Flyway at boot. An OOMKill is the one kill path the liveness/readiness design on this page cannot see at all — it never goes through a probe, so the DEGRADED / liveness split (Probes, and Why Liveness and Readiness Are Split) cannot soften it, and a pod that OOMKills mid-migration looks nothing like the graceful-shutdown or ClickHouse-outage cases this page otherwise accounts for. The cost of the extra headroom is about 100 MiB of heap a 10 000-entry result buffer does not need.
To override the percentage, use extraEnv with _JAVA_OPTIONS, never JAVA_TOOL_OPTIONS. The JVM reads JAVA_TOOL_OPTIONS before the command line, so a MaxRAMPercentage set there loses to the flag the entrypoint already sets; _JAVA_OPTIONS is read after the command line and wins. JAVA_TOOL_OPTIONS remains the right place for flags the entrypoint does not set at all (-XX:+HeapDumpOnOutOfMemoryError, agents). Full reasoning and the values-file syntax: helm/ft-fcc-service/README.md, "Resources, replicas, shutdown".
The Helm Chart
helm/ft-fcc-service/, versioned together with the image in this repository. Full values reference, troubleshooting recipes and the complete rationale for every default: helm/ft-fcc-service/README.md. What follows is what an operator decides before the first install.
| Decision | What it means here |
|---|---|
|
A plain |
|
Not a disabled Ingress template — the file does not exist. A disabled template is an invitation: it tells the next operator that Ingress is a supported configuration that merely happens to be switched off. It is not. Its absence is the statement. |
Passwords live in a |
Five keys only ( |
|
|
Chart version
A numeric
|
Why /tmp Is Mounted, Specifically
With a read-only root filesystem the JVM still needs a writable temp directory (hsperfdata, NIO temp files), and Spring spools multipart parts to the Java temp directory — PUT /FCC/item/import, PUT /FCC/devices/import and POST /FCC/devices/resolve (and POST /FCC/devices/count) all take a file upload, each bounded at FCC_SERIAL_FILE_MAX_SIZE (default 10 MB). tmpDir.sizeLimit (default 128Mi) is set comfortably above that ceiling to absorb concurrent uploads plus whatever else the JVM parks there; it counts against the node’s ephemeral storage, which is what makes it worth capping at all rather than leaving unbounded. tmpDir.medium can be set to Memory for a tmpfs, at the cost of counting against the pod’s memory limit instead.
Probes, and Why Liveness and Readiness Are Split
This is the most important section on this page: getting it wrong has one specific, repeatable, and entirely avoidable failure mode.
The Trap
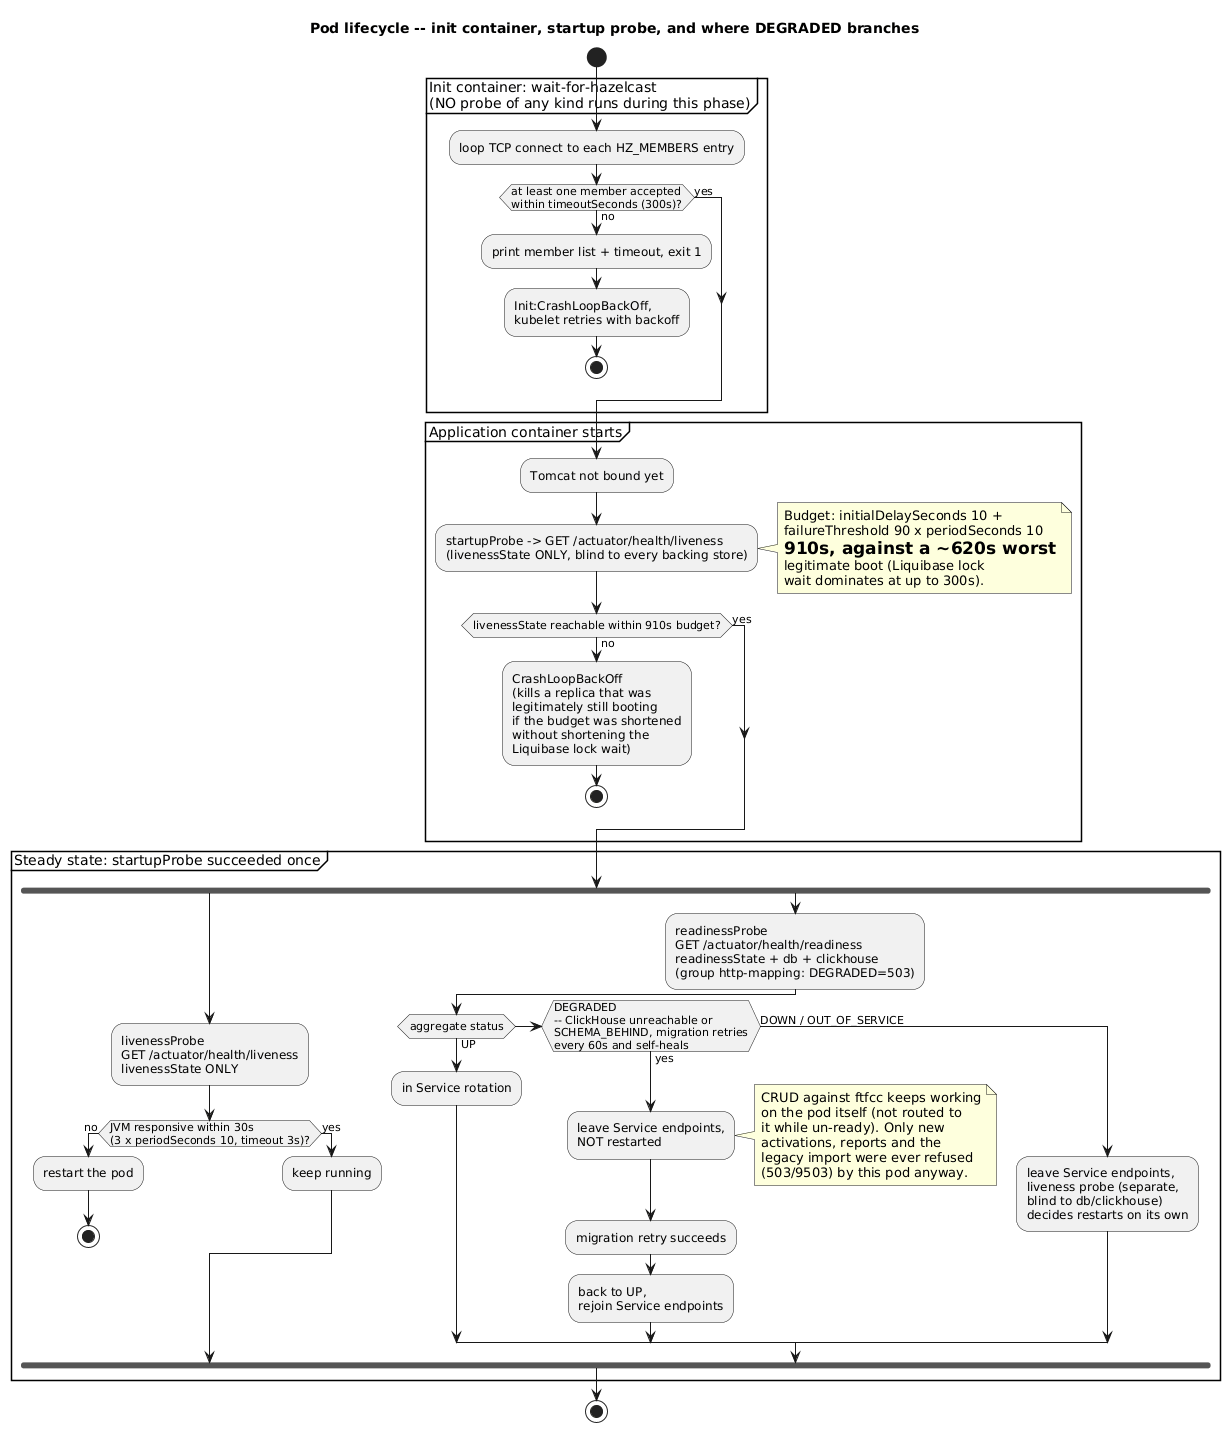
The aggregate GET /actuator/health maps the custom status DEGRADED to HTTP 200, on purpose (Health). ClickHouse being unreachable, or reachable with its schema behind pending migrations (SCHEMA_BEHIND), is a state this service is explicitly designed to survive: the migration retries on ft.fcc.clickhouse.migration.retry-interval (default 60s) and heals itself, and CRUD against ftfcc keeps working throughout — only new result-producing work (activations, reports, the legacy import) is refused with 503/9503.
A liveness probe pointed at that aggregate endpoint would restart the pod precisely while it is waiting for ClickHouse to come back — and the retry that would have healed it never gets to finish, because the JVM does not live long enough between restarts to let it. A single-instance ClickHouse outage would turn into a cluster-wide CrashLoopBackOff that reads, from the outside, exactly like a bug in this service.
What the chart does instead
| Probe | Endpoint | Sees |
|---|---|---|
|
|
|
|
|
|
|
|
|
A degraded pod therefore leaves the Service endpoints — so the load balancer stops sending it new work that would only fail against a store it cannot reach — but is not restarted, so the migration retry that would heal it is never interrupted.
|
A Spring Boot trap that is easy to reproduce by accident: a group-level The same trap has a second, load-bearing form one level up: the readiness group declares no |
|
Since M5, This was accepted, not merely allowed to happen, and it is a different status from the one Health spends most of its space on. A service that is refusing traffic answering "I am refusing traffic" is arguably the more honest behaviour; the |
Why ClickHouse Is Not in the Readiness Group by Default
The default is readiness.includeClickHouse: false (rendering FCC_READINESS_INCLUDE=readinessState,db), and this section is why. With true, ClickHouse being shared and cluster-wide means a ClickHouse outage takes every replica un-ready at the same instant. The Service then has no endpoints at all, and ui-backend gets connection failures — for plain campaign CRUD too, not only for report and activation traffic — even though decision Q3' promises exactly that CRUD keeps working while the service is DEGRADED.
The default therefore keeps that promise: the pods stay in rotation, CRUD keeps working, and report/activation traffic answers an honest 503/9503 from a pod that is reachable rather than not being reachable at all.
The two-line decision rule:
-
If
ui-backenddegrades gracefully on a 9503 and CRUD availability during a ClickHouse outage matters more than "every pod in rotation is fully working" →includeClickHouse: false. -
If you would rather have no endpoint at all than a half-working one, or a genuinely per-pod ClickHouse problem is possible in your topology (per-pod network policy, per-pod credentials, sharded routing) → leave it
true, because in that topology removing the affected pod actually helps.
readiness.include overrides the rendered list outright when neither boolean expresses the combination you need.
The Startup Budget, and Why It Is What Lets Liveness Be Strict
startupProbe (initialDelaySeconds: 10, periodSeconds: 10, failureThreshold: 90) budgets 910 seconds (10 + 90 x 10) of boot time. Verified against helm/ft-fcc-service/values.yaml:
| Phase | Worst legitimate cost |
|---|---|
JVM start and Spring context up to the |
~45s |
|
up to 45s ( |
Liquibase |
up to 300s (Liquibase default |
Liquibase cold run: ~50 changesets, 17 tables plus indexes, loaded database |
up to 120s |
|
up to 30s |
ClickHouse Flyway pass: connect ( |
~60s |
Rest of the context refresh, Tomcat bind |
~20s |
Total, worst legitimate boot |
~620s |
910s covers that with roughly 45% headroom. The item that actually forces the number is the 300s Liquibase lock wait: with replicaCount > 1, every replica but one legitimately sits idle behind the one running the migration, and a short startup budget would kill and restart exactly the replica that is behaving correctly — the pod doing nothing wrong except waiting its legitimate turn. This is the same trap DEGRADED sets one layer up (The Trap), one layer down in the boot sequence rather than in steady-state operation.
Being generous here is precisely what lets liveness stay tight (failureThreshold: 3, periodSeconds: 10, timeoutSeconds: 3 — about 30s of a non-responding JVM before a restart): liveness does not run at all until the startup probe has succeeded once, so a startup budget sized against the worst case never costs steady-state responsiveness anything.
Kubernetes runs no probe of any kind against the application container while the wait-for-hazelcast init container is running (The Hazelcast Init Container, and the Two ACS Failures It Cannot Fix) — init containers run to completion before the kubelet starts the main container, and a container that has not been started is never probed. So the init wait can never cause the application container to be restarted; the only bound on that phase is the init container’s own timeoutSeconds.
progressDeadlineSeconds: 1200 — the Deployment Controller Has Its Own Clock, Sized Separately From the Startup Probe
The startup budget above (910s) governs when the kubelet gives up on a single pod. It says nothing about when the Deployment controller gives up on the rollout as a whole, and that is a second clock, progressDeadlineSeconds, whose Kubernetes default — 600 seconds — sits below the 910s this page spends two tables justifying. On the exact scenario the 910s budget exists for — replicaCount > 1 against a cold ftfcc, every replica but one legitimately queued behind the 300s Liquibase changelog-lock wait — the pods are not killed by anything, but the Deployment reports ProgressDeadlineExceeded at 600s regardless, and kubectl rollout status (which NOTES.txt tells an operator to run) exits non-zero. A pipeline running helm upgrade --wait --atomic reads that non-zero exit as a failed rollout and rolls back in the middle of a Liquibase migration — on precisely the replica set that was behaving correctly. The chart now sets progressDeadlineSeconds: 1200, above the startup budget, for the same reason the startup budget itself is generous: a pod correctly waiting its turn must never look, to any layer of tooling, like a pod that failed.
helm upgrade --wait (or --atomic) needs a matching --timeout of at least 20m. Helm’s own default --timeout is 5 minutes, independent of both Kubernetes clocks above, and expires long before either one — an --atomic rollback triggered by that timeout interrupts a migration exactly as the ProgressDeadlineExceeded case above did, for a reason that has nothing to do with either progressDeadlineSeconds or the startup probe.
The preStop Sleep, and Why terminationGracePeriodSeconds Alone Never Covered Endpoint Propagation
terminationGracePeriodSeconds (default 45) delays the kill — the kubelet sends SIGTERM at t=0 regardless and only sends SIGKILL at t=grace. It does not delay SIGTERM itself, and a comment that used to stand on this chart said it did. Because SIGTERM and endpoint removal are dispatched by the control plane at the same instant, they race each other across every kube-proxy in the cluster: without something to close that race, Spring can begin its graceful shutdown — server.shutdown: graceful, spring.lifecycle.timeout-per-shutdown-phase: 20s — while some nodes are still routing live traffic to a pod that is no longer accepting it, and ui-backend sees connection-refused on every rollout. maxUnavailable: 0 does not help here: the pod being torn down is the old one, which is already in the `Service’s endpoints by definition.
The chart now runs a preStop hook (preStopSleepSeconds, default 5, exec + /bin/sleep) before SIGTERM is sent — the container is not signalled until the hook returns — which is what actually closes the gap: the sleep is the propagation delay, not additional shutdown time, but it does count against terminationGracePeriodSeconds, which is why raising one number usually means raising the other. The default’s arithmetic is 5 (preStop) + 20 (the graceful-shutdown phase timeout) + slack for the Hazelcast take() consumers to unwind, comfortably inside the default 45. A large export in flight is still cut off at the deadline regardless — that remains expected, and the operator reruns it.
readinessProbe.timeoutSeconds: 5 vs. HIKARI_CONN_TIMEOUT_MS: 45000 — Deliberate, Do Not "Fix" It
With the ftfcc database unreachable, DataSourceHealthIndicator blocks inside getConnection() for the whole Hikari connection-timeout before it can answer — about 45 seconds. readinessProbe.timeoutSeconds is set to 5, far below that, and Kubernetes reads a probe timeout as a probe failure, i.e. "not ready" — the same verdict the 503 would eventually have carried, reached about 40 seconds sooner.
Raising probes.readiness.timeoutSeconds to 45 "to let the health check finish" is the wrong fix: the only effect would be that a pod whose database is genuinely dead keeps receiving live traffic it cannot serve for three quarters of a minute per probe cycle, before anything notices and routes around it.
The Hazelcast Init Container, and the Two ACS Failures It Cannot Fix
initContainers.waitForHazelcast (enabled by default) runs a small busybox container that loops a TCP connect against HZ_MEMBERS until at least one member accepts, then exits; it gives up loudly after timeoutSeconds (default 300s), printing the timeout and the member list it parsed and exiting 1 — visible as Init:CrashLoopBackOff, retried with backoff by the kubelet.
This init container protects this service’s own pod, and nothing else. It does not, and cannot, protect the ACS from either of its own two Hazelcast startup failure modes. Both come out of the ACS’s own HazelcastCacheFactory (HazelcastCacheFactory.java:50-92), where createHazelcastInstance(… "hazelcast-client.xml") sits inside a catch (Exception e) whose handler creates an embedded Hazelcast member and sets LOCAL_USED = true. Which of the two failures actually happens depends entirely on whether that call throws or blocks:
| Mode | What happens |
|---|---|
Mode 1 — Hazelcast unreachable, client config present: the ACS start blocks indefinitely |
The shipped client config sets |
Mode 2 — client config missing or unreadable: the ACS comes up as an isolated embedded member |
When |
In docker-compose, mode 1 is prevented by depends_on: { hazelcast: { condition: service_healthy } } and mode 2 by the bind mount that puts hazelcast-client.xml into the ACS container. In Kubernetes, nothing prevents either. This chart’s init container protects only this pod’s own start; preventing mode 1 on the ACS side needs an equivalent init container in the ACS’s own Helm chart, and preventing mode 2 needs that chart to mount a client config and fail loudly if it is absent — neither exists in this repository, and this chart cannot reach into the ACS’s own. Mode 2 additionally needs somebody to actually scrape /actuator/fcc and alert on hazelcastLocalUsed; detection only helps if something is watching it.
The contrast a reader will otherwise get wrong: this service does not block on Hazelcast at all, unlike the ACS. Its client starts asynchronously (ClientConnectionStrategyConfig.setAsyncStart(true)), management.health.hazelcast.enabled is false, and "not connected yet" is treated as an expected transient state rather than a reason to report DOWN — so an unreachable cluster delays nothing in this service’s own startup budget (The Startup Budget, and Why It Is What Lets Liveness Be Strict); the wait-for-hazelcast init container, which runs before any of it, is the component that actually waits.
Treat a green init container as "this pod found Hazelcast", never as "the ACS is on the same cluster". Confirm the second claim independently, through the ACS’s own /actuator/fcc and its hazelcastLocalUsed detail.
Minimum ACS Version
ACS 6.4.12 or later is required — see ACS 6.4.12 Is the Minimum Version for the full reasoning (FtacsSchemaCheckRunner requires the bom / eom columns of ug_fcc_speed_result, introduced by ACS changelog 6.4.12.a).
Environment Variables
The full reference — every tuning. key, its default and which ft.fcc. property it binds — lives in helm/ft-fcc-service/README.md; the semantics behind each property are in Configuration Reference. This page does not restate either.