FT Services Deployment Documentation
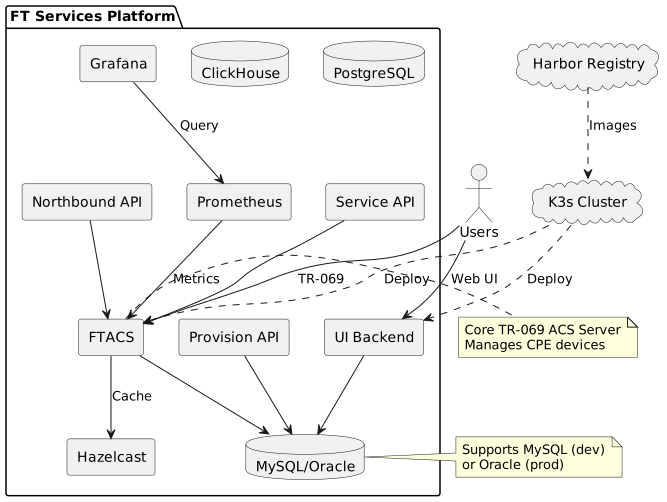
This documentation covers the complete FT Services platform deployment on Kubernetes, including architecture, operations, and troubleshooting guides.
About This Documentation
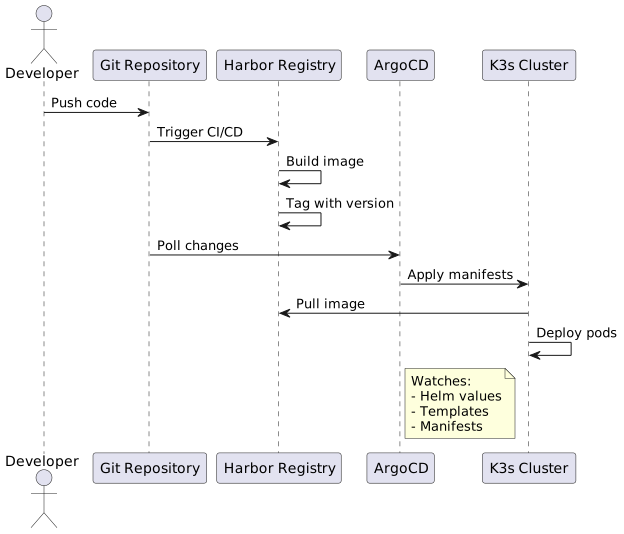
FT Services is deployed on K3s using a GitOps approach with ArgoCD and Helm charts. This documentation provides comprehensive guidance for:
-
Understanding the system architecture
-
Deploying and managing services
-
Troubleshooting common issues
-
Following operational runbooks
-
Understanding architectural decisions
Quick Links
| Topic | Description |
|---|---|
Complete overview of the FT Services architecture, components, and deployment strategy |
|
Web UI for creating and managing dynamic deployment environments |
|
Automatic image updates for static environments |
|
Solutions to common issues and debugging procedures |
|
Step-by-step guide for environment creation, deletion, and management |
|
Procedures for backup, restore, and disaster recovery scenarios |
|
Decision to implement web-based environment management |
Environments
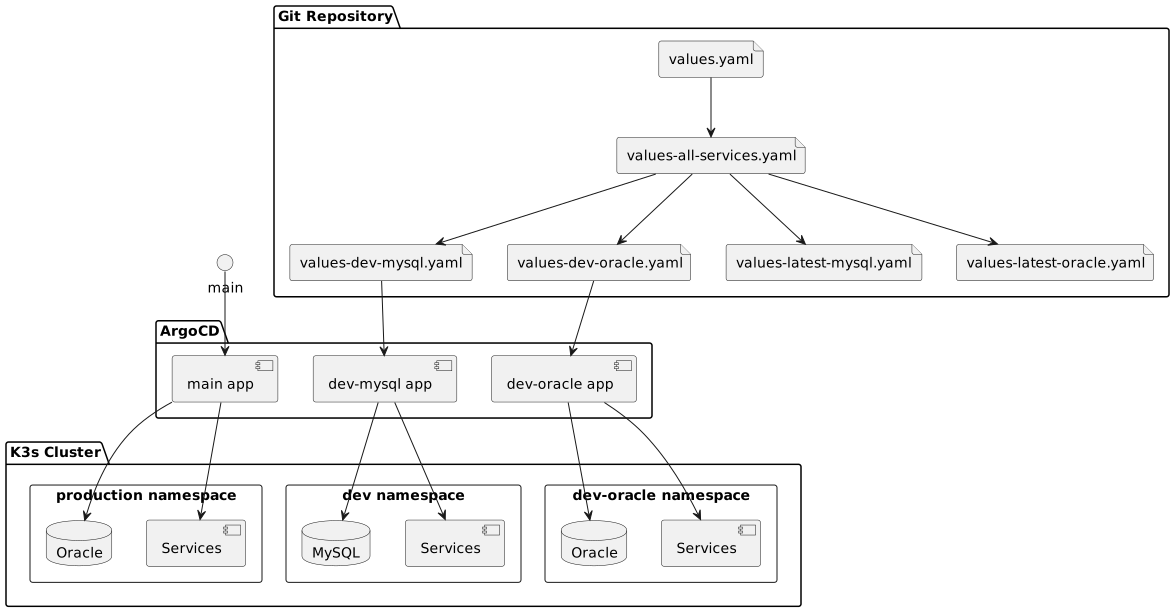
The platform supports multiple deployment environments:
| Environment | Purpose | Database | Resources |
|---|---|---|---|
|
Development with MySQL |
MySQL 8.4 |
Low |
|
Development with Oracle |
Oracle XE 21 |
Medium |
|
Feature branch testing |
MySQL/Oracle |
Minimal |
|
Production |
Oracle XE 21 |
High |
Key Technologies
-
Kubernetes: K3s cluster orchestration
-
GitOps: ArgoCD for continuous deployment
-
Package Management: Helm charts
-
Container Registry: Harbor
-
Monitoring: Prometheus + Grafana
-
Logging: Loki + Promtail
-
Service Mesh: Traefik ingress controller
Architecture Highlights
Microservices Architecture
The platform consists of 17 microservices organized in layers:
@startuml
skinparam backgroundColor transparent

package "Frontend" {
    [UI Portals]
    [UI AI Agent]
}

package "API Gateway" {
    [UI Backend]
}

package "Business APIs" {
    [Northbound API]
    [Service API]
    [Provision API]
}

package "Core" {
    [FTACS]
    [Device Network Service]
}

package "Data" {
    database MySQL/Oracle
    database PostgreSQL
    database ClickHouse
}

[UI Portals] --> [UI Backend]
[UI AI Agent] --> PostgreSQL
[UI Backend] --> [FTACS]
[Northbound API] --> [FTACS]
[Service API] --> [FTACS]
[Provision API] --> MySQL/Oracle
[FTACS] --> MySQL/Oracle
[Device Network Service] --> [FTACS]

@enduml
Getting Started
-
Review the System Architecture
-
Check Troubleshooting Guide for common issues
-
Follow Runbooks for operational procedures
-
Read Architecture Decision Records to understand design choices
Environment Manager
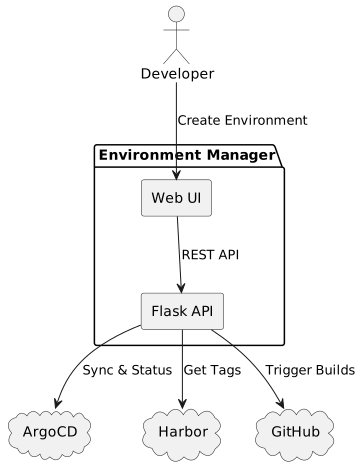
The Environment Manager provides a web-based interface for self-service environment creation and management.
Features
-
Create Partial Environments - Deploy selected services using parent database
-
Create Full Environments - Deploy complete isolated environments
-
Harbor Integration - Browse and select image tags
-
GitHub Integration - Build images from Git branches
-
ArgoCD Sync - Immediate deployment with optimized sync
Quick Start
-
Navigate to Environment Manager:
http://localhost:8080 -
Click "Create" tab
-
Enter environment name (e.g.,
feature-user-123) -
Select services and image sources
-
Click "Create Environment"
See Environment Manager Documentation for complete guide.
Feature Branch Workflow
Via Environment Manager (Recommended)
Use the web UI for a guided environment creation experience with real-time validation and Harbor tag browsing.
Via Shell Script
# Create feature environment
./scripts/create-feature-env.sh TICKET-123 mysql

# Access your environment
curl https://feature-ticket-123.rd.friendly-tech.com/acsstats

# Destroy when done
./scripts/destroy-feature-env.sh TICKET-123
See ADR-002 for the strategy behind this approach.
Monitoring & Observability
Contributing
To contribute to this documentation:
-
Documentation source is in AsciiDoc format
-
Follow the AsciiDoc style guide
-
Submit changes via pull request
-
Ensure all diagrams render correctly
Support
For issues or questions:
-
Check Troubleshooting Guide
-
Review relevant Runbook
-
Contact DevOps team on Slack
Last updated: 2026-10-14 15:37:31 +0200