Monitoring Architecture
Version 1.6.8 | Updated: July 24, 2026
Monitoring Architecture
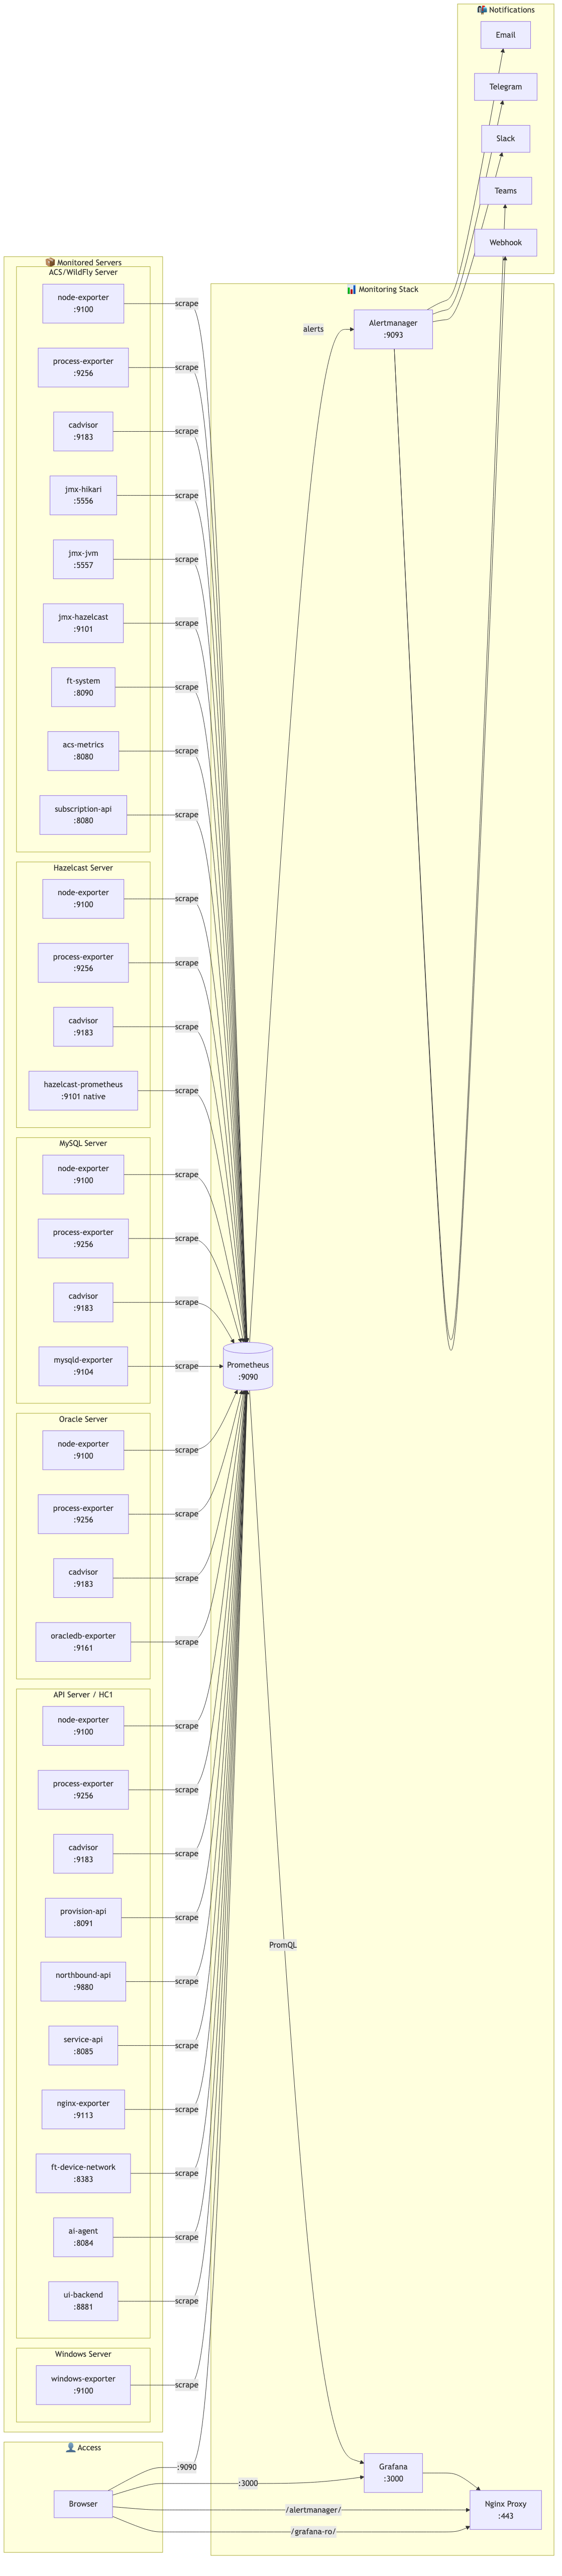
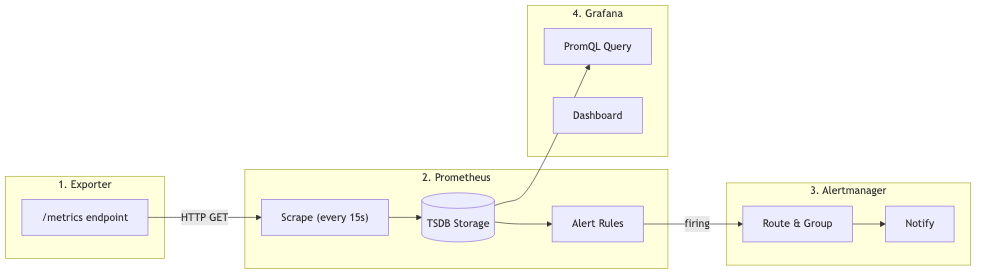
SNMP Trap Flow (Granular OID Mapping)
Each Prometheus alert rule has a unique oid label. When an alert fires, the flow is:
flowchart LR
    subgraph Prometheus["Prometheus"]
        RULE["Alert Rule<br/>oid: 1.3.6.1.4.1.99999.2.0.48"]
    end

    subgraph AM["Alertmanager"]
        ROUTE["Route to<br/>snmp-notifier webhook"]
    end

    subgraph SNMP["SNMP Notifier :9464"]
        PARSE["Extract oid label"]
        MIB["MIB Lookup<br/>FRIENDLY-TECH-ACS-MIB"]
        TRAP["Generate SNMP Trap"]
    end

    subgraph NMS["NMS / Receiver"]
        RX["Receive trap<br/>with unique OID"]
    end

    RULE -->|firing| ROUTE
    ROUTE -->|webhook + labels| PARSE
    PARSE --> MIB
    MIB --> TRAP
    TRAP -->|"SNMPv2c/v3<br/>UDP :162"| RX
Components:
-
Alert Rules (
prometheus_rules.yml,hazelcast_rules.yml,acs_alerting_rules.yml) — 33 alerts with unique OID labels -
Alertmanager — routes firing alerts to snmp-notifier via webhook
-
SNMP Notifier (
:9464) — extractsoidlabel from alert, generates SNMP trap with that OID -
MIB file (
alertmanager/mibs/FRIENDLY-TECH-ACS-MIB.txt) — maps OIDs to NOTIFICATION-TYPE definitions, mounted as external config -
OID Mapping (
alertmanager/mibs/OID-MAPPING.md) — human-readable OID reference -
Thresholds UI (
/alertmanager-config/thresholds) — edit alert thresholds without restart
OID Structure: 1.3.6.1.4.1.99999.2.0.<alert-id>
-
.1.3.6.1.4.1.99999— Enterprise OID (Friendly Technologies) -
.2.0— ACS Notifications branch -
.<alert-id>— unique per alert (1-99: infrastructure, 100-200: reserved for customer)
Server Types & Exporters
| Server Type | Exporters | Ports |
|---|---|---|
ACS/WildFly |
node, process, cadvisor, jmx-hikari, jmx-jvm, jmx-hazelcast, ft-system, acs-metrics, subscription-api |
9100, 9256, 9183, 5556, 5557, 9101, 8090, 8080 |
Hazelcast |
node, process, cadvisor, hazelcast-prometheus (native) |
9100, 9256, 9183, 9101 |
MySQL |
node, process, cadvisor, mysqld-exporter |
9100, 9256, 9183, 9104 |
Oracle |
node, process, cadvisor, oracledb-exporter |
9100, 9256, 9183, 9161 |
ClickHouse |
node, process, cadvisor, clickhouse (native endpoint) |
9100, 9256, 9183, 9363 |
PostgreSQL |
node, process, cadvisor, postgres-exporter |
9100, 9256, 9183, 9187 |
API/HC1 (Angular UI) |
node, process, cadvisor, provision, northbound, service, nginx-exporter, ft-device-network, ai-agent, ui-backend |
9100, 9256, 9183, 8091, 9880, 8085, 9113, 8383, 8084, 8881 |
Windows |
windows-exporter |
9100 |
Metrics Endpoints Reference
System Exporters (Docker containers)
| servers.env TYPE | Port | Metrics Path | Description |
|---|---|---|---|
|
9100 |
|
CPU, RAM, Disk, Network (node-exporter) |
|
9256 |
|
Host process stats (process-exporter) |
|
9183 |
|
Docker container metrics (cAdvisor) |
|
9104 |
|
MySQL database metrics (mysqld-exporter) |
|
9161 |
|
Oracle database metrics (oracledb-exporter) |
|
9363 |
|
ClickHouse database metrics (native Prometheus endpoint) |
|
9187 |
|
PostgreSQL database metrics (postgres-exporter) |
|
9113 |
|
Nginx web server metrics (nginx-exporter) |
|
9100 |
|
Windows system metrics (windows-exporter) |
JMX Exporters (Docker containers)
| servers.env TYPE | Port | Metrics Path | Description |
|---|---|---|---|
|
5556 |
|
HikariCP connection pool metrics |
|
5557 |
|
JVM heap, GC, threads metrics |
Native Application Endpoints
| servers.env TYPE | Port | Metrics Path | Description |
|---|---|---|---|
|
9101 |
|
Hazelcast native Prometheus endpoint |
|
8090 |
|
FT System Spring Boot Actuator |
|
8080 |
|
ACS application business metrics |
|
8080 |
|
Subscription API metrics (FTACS) |
API Service Endpoints (Docker containers / Native Actuator)
| servers.env TYPE | Port | Metrics Path | Description |
|---|---|---|---|
|
8091 |
|
Provision Portal API metrics |
|
9880 |
|
Northbound API metrics |
|
8085 |
|
Service API metrics |
FT UI Services Endpoints (Docker containers / Native metrics)
| servers.env TYPE | Port | Metrics Path | Description |
|---|---|---|---|
|
8383 |
|
FT Device Network Service (Spring Boot) |
|
8084 |
|
AI Agent (Python/FastAPI with prometheus_client) |
|
8881 |
|
UI Backend (when actuator enabled in Spring Security) |
Monitoring Stack
| Service | Port | Description |
|---|---|---|
Prometheus |
9090 |
Metrics storage & query |
Alertmanager |
9093 |
Alert routing & notifications (Email, Telegram, Slack, Teams, Webhook, SMS, SNMP) |
SNMP Notifier |
9464 |
Converts alerts to SNMP traps |
Grafana |
3000 |
Dashboards & visualization |
Nginx |
80/443 |
Reverse proxy, HTTPS, /grafana-ro/, /alertmanager/ |