Architecture Overview
1. System Context
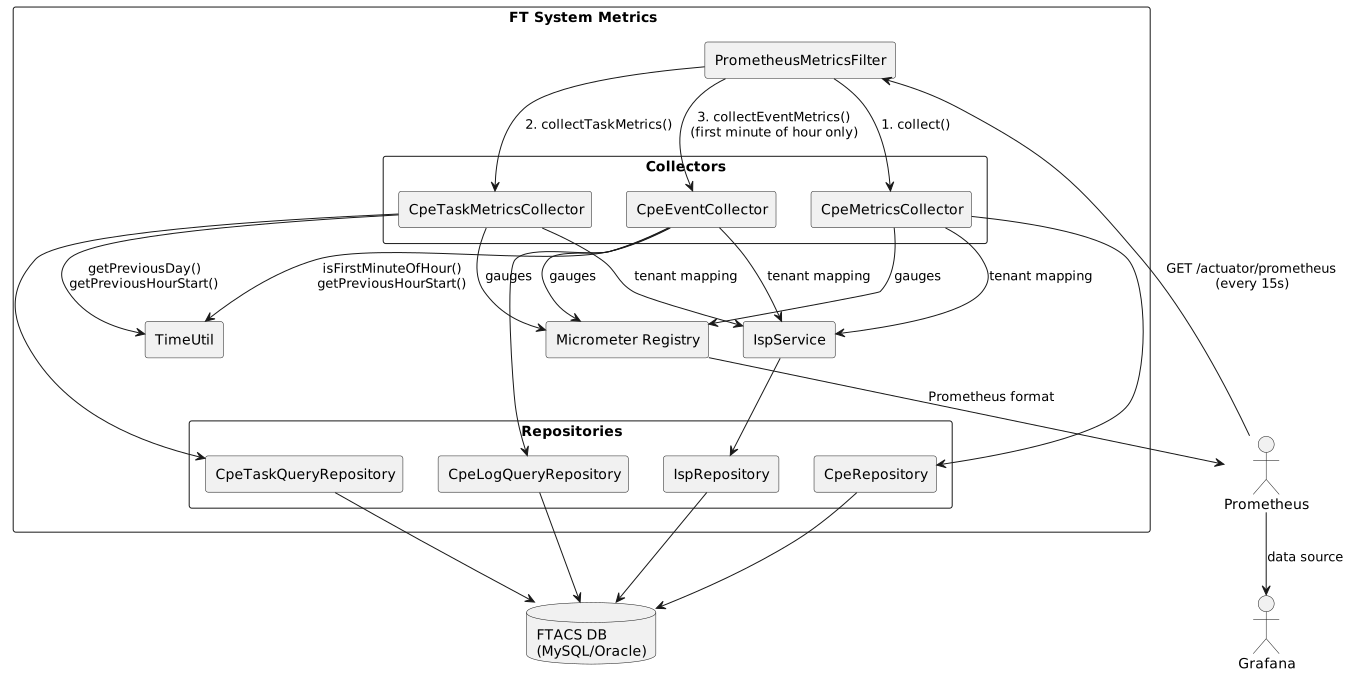
FT System Metrics is a satellite service for the FTACS platform. It connects to the FTACS database in read-only mode and exports aggregated metrics for Prometheus.
1.2. Core Operations
-
Device Metrics — device count by protocol and tenant, online/offline status
-
Task Metrics — task distribution by status and type over time windows
-
Event Metrics — CPE event distribution by type for the previous hour
-
Multi-tenant Tagging — all metrics are tagged with the ISP/tenant name
2. Component Architecture
2.2. Key Components
| Component | Description |
|---|---|
|
A |
|
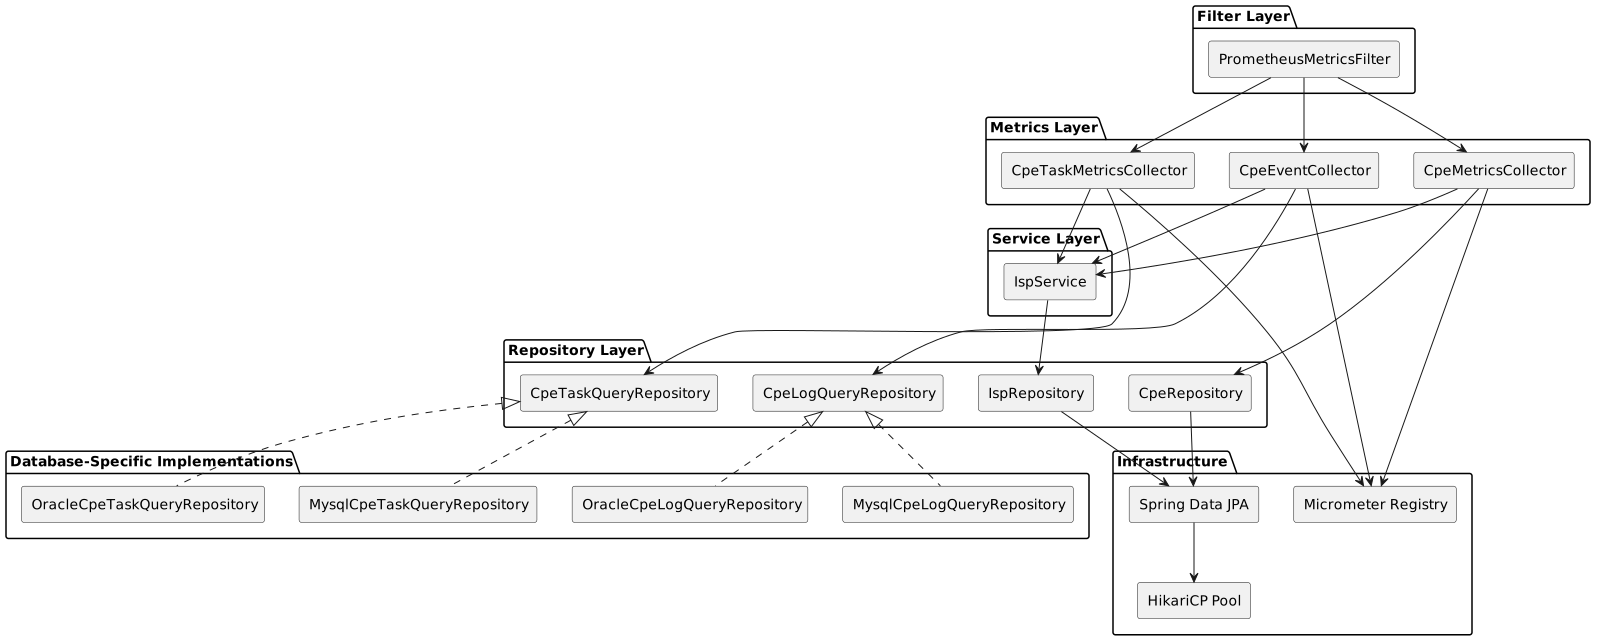
Collects device metrics: total count by protocol, online/offline status. TR069 devices determine online status via the |
|
Collects task distribution by status (Pending, Completed, Failed, Rejected, Sent) for the current and previous day, as well as distribution by task type for the last 24 hours. |
|
Collects CPE event distribution by type for the previous hour. Only executes during the first minute of each hour ( |
|
Maps ISP/tenant IDs to names for metric tagging. Handles the super domain (ID=0) separately. |
|
Utility for computing time windows: start/end of the previous hour, previous day, and first-minute-of-hour check. |
|
The Micrometer metrics registry. Gauges store current values in a |
3. Request Flow
3.2. Flow Description
-
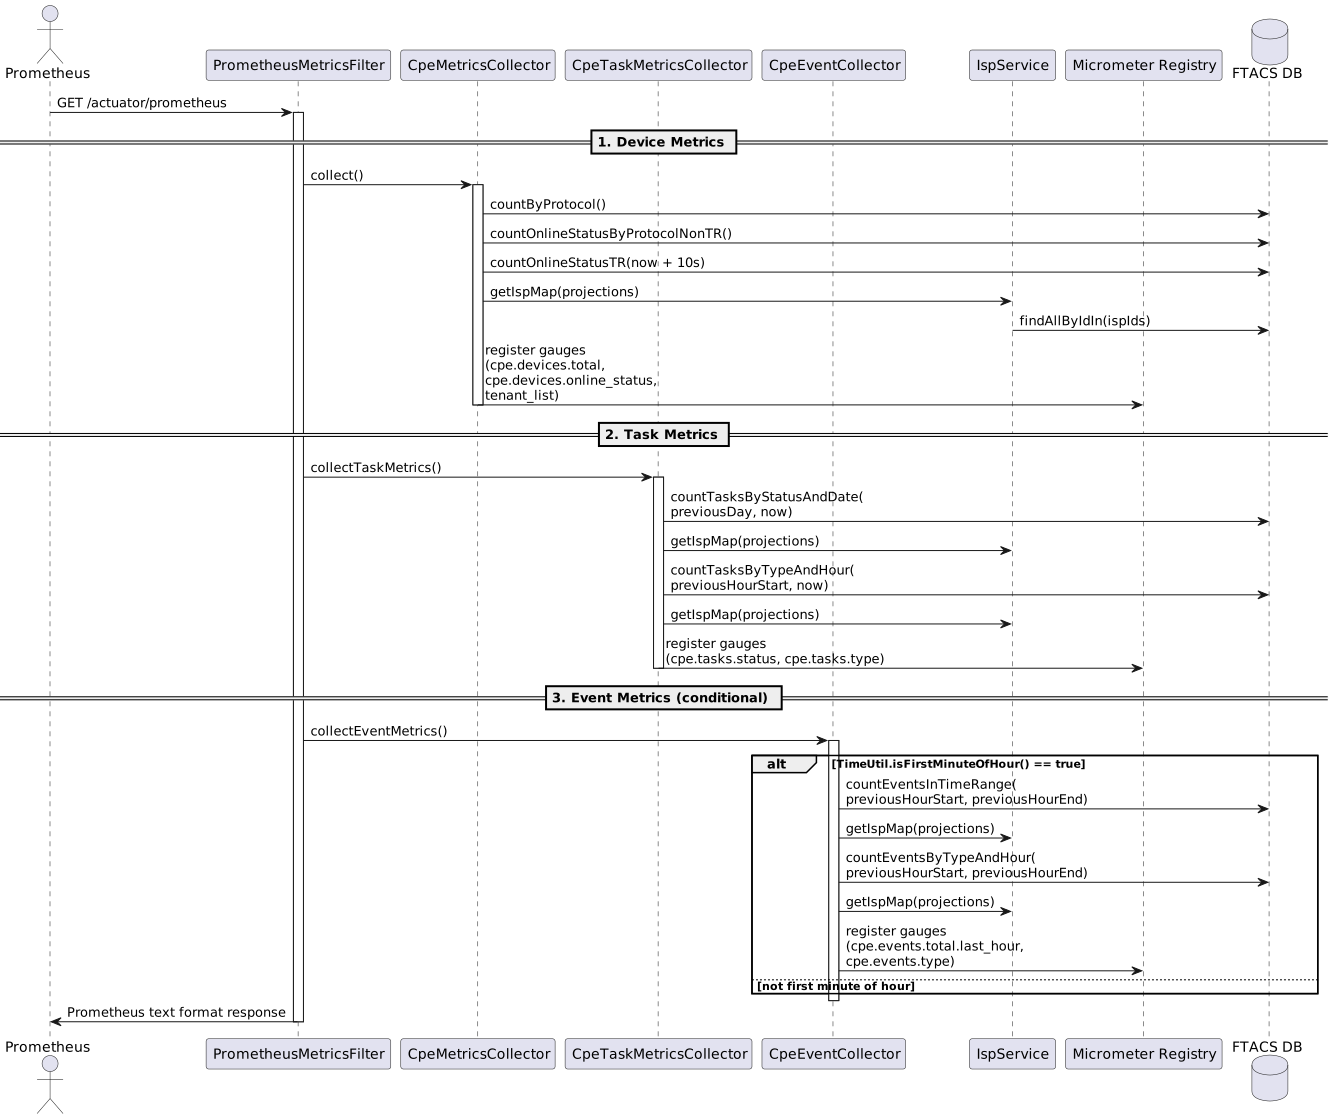
Prometheus sends a GET request to
/actuator/prometheusevery 15 seconds -
PrometheusMetricsFilterintercepts the request and sequentially invokes three collectors -
Each collector executes SQL queries against the database via JPA repositories
-
Query results are mapped onto Projection interfaces
-
Collectors register Gauge metrics in the Micrometer Registry with tags (tenant, protocol, status, etc.)
-
The Actuator Prometheus endpoint formats the response in Prometheus text format
4. Multi-Database Strategy
The application supports MySQL and Oracle through the Strategy pattern with Spring Profiles:
CpeTaskQueryRepository (interface)
+-- MysqlCpeTaskQueryRepository  (@Profile("mysql"))
+-- OracleCpeTaskQueryRepository (@Profile("oracle"))

CpeLogQueryRepository (interface)
+-- MysqlCpeLogQueryRepository   (@Profile("mysql"))
+-- OracleCpeLogQueryRepository  (@Profile("oracle"))
4.1. Key Differences Between Implementations
| Feature | MySQL | Oracle |
|---|---|---|
Date formatting |
|
|
Hour formatting |
|
|
GROUP BY |
Allows aliases in GROUP BY |
Requires full expressions in GROUP BY |
Profile activation |
|
|
4.2. Profile Selection
The database profile is determined by the DB_VENDOR variable in the Dockerfile:
ENV DB_VENDOR=mysql
ENTRYPOINT ["sh", "-c", "java $JAVA_OPTS -Dspring.profiles.active=${DB_VENDOR:-mysql} -jar app.jar"]
In application.yml, profiles are grouped as follows:
spring:
  profiles:
    group:
      mysql:  [ common, mysql ]
      oracle: [ common, oracle ]
The common profile contains shared JPA and HikariCP settings, while the mysql/oracle profiles hold database-specific parameters (driver, URL, dialect).