Running Tests
This page covers the Overview, Test cases and Runs sections — everything from batch trigger to live observability and post-run inspection.
The UI talks to a gateway that fans requests out to a pool of generic worker containers. You pick a target environment (env profile) per run; the gateway materializes that env’s settings onto a free worker and schedules the run there. See Environments & the Gateway for the gateway/worker model.
| These sections used to be header tabs named Dashboard / Tests / Runner. Since the 2026-09 redesign they are entries in the left sidebar, grouped under Run (Overview, Test cases, Runs), Author (Editor) and Admin. Test cases is the landing section after login. |
|
Per-account isolation, and its one deliberate exception. Run history,
The exception is a wave in flight: a batch running on any worker is shown to every account as a read-only Wave in progress card, and the admin Workers section has a Busy column reporting what each worker runs whoever owns it. Both exist so nobody redeploys a stand out from under a colleague’s batch. Neither exposes another account’s report — the foreign run id and env are redacted. |
|
At a glance
|
Reading a Verdict
Before the screens, the vocabulary. Since 2026-09-03 a run carries two independent facts: what the verdict was, and who reached it.
Status
| Pill | Meaning |
|---|---|
|
Every asserting step was satisfied. |
|
At least one step was measured and did not hold. |
|
At least one claim was not measured. The judge either quoted nothing from the captured page, or the run captured nothing to judge against. This is not a product failure and it is not a pass — see troubleshooting.adoc#amber. |
|
The run itself broke (CLI, MCP, timeout, stopped by a user). |
|
The case never started: its infrastructure precondition is not available on
this stand. A blocked run is recorded as a run — it is not a |
|
Self-explanatory. |
Overall status folds the steps as FAIL > INCONCLUSIVE > PASS: one unmeasured claim makes the whole run amber.
Judge
Next to every verdict — on a step, a run row, and in the batch report — sits a small tag naming what decided it:
| Tag | What actually looked at the claim |
|---|---|
Measured |
A deterministic check: a |
Keywords |
The expected text’s keywords were found in the page text. Deterministic but shallow: it proves the words are on the screen, not that the claim holds. |
LLM-judged |
Claude read the page and decided. Valid only with a verbatim quote from what
was captured — an ungrounded PASS is downgraded to |
Unverified |
Nothing asserted anything: a bare navigation, an auto-filled step, or a verify helper that was unavailable. |
A run’s judge is the weakest judge among its asserting steps, so one LLM-judged claim marks the whole run LLM-judged. This is what the Overview KPI Measured passes counts, and what the Last: pass, not measured filter finds.
Overview
Aggregates the run history for the calling user (admins see all users' runs). The gateway merges the histories of every worker, owner-scoped to you, so a run that landed on any worker still shows up here.
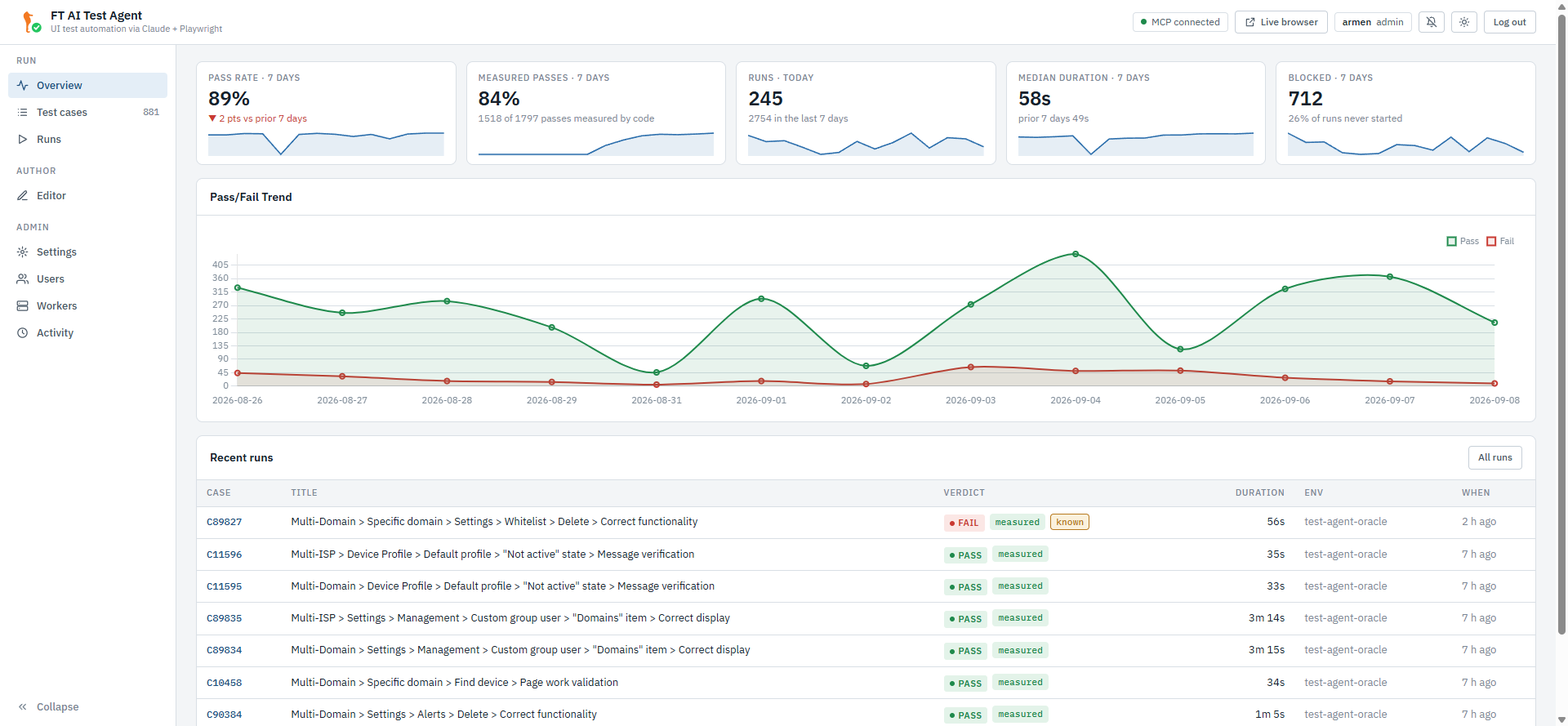
KPI Cards
Five cards, each with a value, a delta and a 14-day sparkline. The window is the last 14 days: "current" is the last 7 days, "prior" the 7 before it. Blocked runs are excluded from the rate and the duration — a case that never started should not move either number.
| Card | Value |
|---|---|
Pass rate · 7 days |
Passed ÷ executed (everything except |
Measured passes · 7 days |
Of the passes that carry a judge, the share judged programmatic. This is the honesty metric: a high pass rate with a low measured share means the greens rest on an LLM reading a page. |
Runs today |
Runs started today. The line underneath gives the number of runs in the last 7 days. |
Median duration · 7 days |
Median elapsed time of executed runs. |
Blocked · 7 days |
Runs that never started, and what share of all runs that is. |
Pass/Fail Trend
A stacked bar chart below the cards, once any runs exist. It shows one bar for each of the last 14 days. A day without runs shows an empty bar. Each bar stacks pass, fail, inconclusive and blocked runs. Errors count as fails. The chart is re-rendered when you switch theme.
Recent Runs
The eight most recent runs — Case | Title | Verdict | Duration | Env | When.
The verdict cell carries the status pill, the judge tag, and a known badge
when the failure is already in the known-issues registry. Identical rows in a
row show as one row with a count, for example ×2. Rows are identical when
case, verdict and environment match. Clicking a row opens
its report panel over the Overview. All runs jumps to Runs.
There are no filters here; the filters live on the run history.
Wave in Progress
Above both Overview and Runs, one card per batch currently in flight on any worker — yours or a colleague’s. It shows the wave’s name and its project / section, the env, the worker, the owner and the model, a five-segment progress bar (pass / fail / inconclusive / error / blocked), the counts, an ETA, when it started, and the case being executed right now. If the wave is yours there is a Live view button and, while it is still running, Edit run (see test-management.adoc#run-edit).
A paused wave says so, with the reason — most often the Claude usage quota, which the runner waits out rather than abandoning the batch. The wave keeps its worker and its emulator for the whole pause and resumes there by itself, so a run aimed at that worker, or at any env on the same emulator, is refused until the wave ends, exactly as while it is running. Nothing is queued: start it again later, or ask the wave’s owner to stop it.
Test Cases
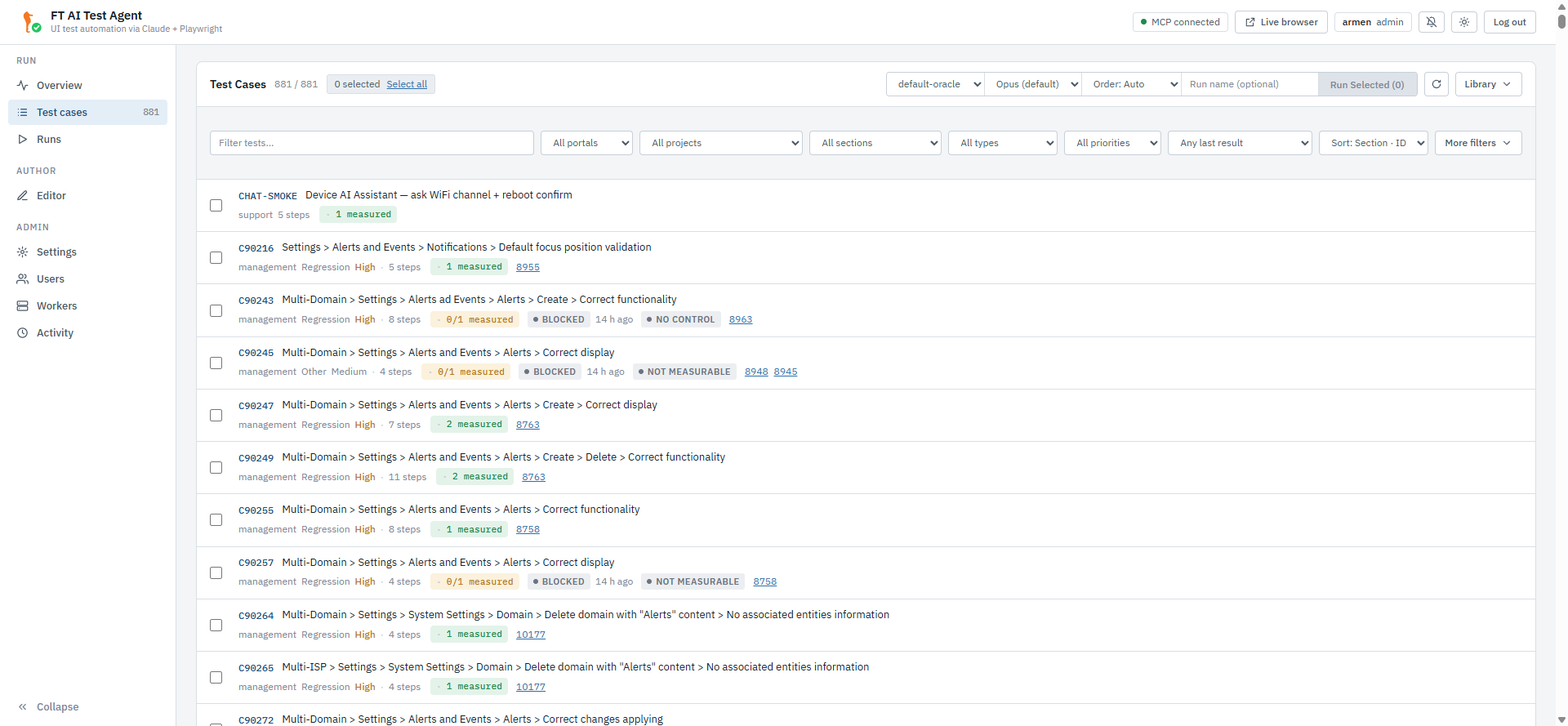
Lists every YAML under /app/tests/cases/ on the stand your session is
pointed at — a stand pinned to your account, an admin’s X-Stand header, the
stand you made active, else the first enabled one. That is not necessarily the
worker a run will land on: each worker keeps its own test-cases volume, and
the case body behind a single row is read from the primary worker instead. See
Which worker answers, and why it matters.
(DRAFT- and EXPLORE- files are excluded — they are not batchable.) Each row
is two lines:
-
Top line — the
C<TestRail-id>identifier and the full title. -
Second line — portal / type / priority pills and the step count; a claims chip; the last run pill; a blocked pill where applicable; Jira references; and, on hover, a pencil that opens the case in the Editor and a Copy button that duplicates it under a free id (test-management.adoc#duplicate).
| Chip | Meaning |
|---|---|
|
How many of the case’s assertions are decided by a deterministic check. Amber when only some are. |
last-run pill |
The case’s own last verdict, with its judge tag and how long ago. Click it to open that run’s report. |
|
The case is marked blocked, and why. Hover for the full category list. |
The Header
The header is read top to bottom, and each row answers one question.
Row 1 — what is selected, and how a run of it is made. The title, then the
shown / total counter, then the selection pill (N selected, Select all,
Clear). Then one bordered run bar holding, left to right, the
environment picker, the model picker, the order picker, an optional run name and
the run button. It reads Run N on env and names the cases and the
environment. After it a Bulk actions menu with Run QA-verified regression
and Publish all pending, an icon-only Refresh, and a
Library menu holding New test case, New project, Import XML…,
Sync runs… and Trash (N).
Row 2 — what the list shows. The search box, then the filters All portals, All projects, All sections, All types, All priorities and Any last result; then the Sort select, Reset filters (shown only while a filter is set) and the More filters toggle, whose label carries the number of active hidden filters.
Row 3 — the rare filters. Shown only while More filters is open: Any ISP mode, Any run, Any claims. The row opens by itself when one of the three becomes active, and remembers whether it was open between visits.
Filtering
The filters narrow the list, never the selection: a case you have ticked
stays ticked when the next keystroke hides it. That is how a batch of two is
assembled by id — tick C11653, search for C91355, tick that one as well,
and both ride into the run.
What the current filters hide is named rather than dropped: the pill reads
N selected and, when some of them are off screen, M hidden beside it, while
the run button always counts the whole selection. So a wave is disclosed
instead of being trimmed behind you.
A wave of more than ten cases asks once before it starts. The question names the case count, the environment and the model. If the filters hide some selected cases, the question also names how many. Ten cases or fewer start at once.
| Up to the 2026-09-08 build every filter DROPPED the cases it hid from the selection. It kept Select all over the corpus plus one keystroke from starting 881 runs, but it also made picking two cases by id impossible — the second search emptied what the first had picked. |
| Filter | Values |
|---|---|
Search |
Case-insensitive substring over ID, title, reference and section —
|
Portal |
All portals / Support / Management. |
Project |
A single project, or |
Section |
One section, each option carrying its case count. Built from the cases themselves, so a freshly imported section needs no configuration. |
Type |
One case type ( |
Priority |
One priority ( |
Last result |
|
ISP mode (More filters) |
|
TestRail run (More filters) |
Membership in a TestRail run (e.g. |
Claims (More filters) |
|
Reset filters appears as soon as any of the ten is set, and clears all ten at once.
Sort orders the list: Section · ID (the default), Title, Type,
Priority, Reference or Last run. Under Title, Type and Reference an
empty value sorts last, a case with no priority sorts after every known one,
and a never-run case sinks to the bottom of Last run; the default Section ·
ID is the exception — it compares sections as plain text, so a case with no
section sorts first. Priority sorts Critical first rather than
alphabetically, and every key breaks ties on a numeric-aware id compare, so C9
precedes C10.
The list is fetched whole (GET /api/tests, no query string) and the
browser does the filtering and the sorting. The same narrowing is available to
an API caller as query parameters — see
Test Management → Search, Sort and Filters —
but the two sets are not identical: the API can sort by id and by edited,
the UI offers Last run instead.
|
Selecting and Running
Tick the checkbox or click the row body to toggle. Select all adds every
currently filtered row to the selection — it does not replace it, so the case
picked under an earlier search survives; Clear empties the selection and is
always in place, greyed out while there is nothing to clear. Both sit in the
selection pill beside the title, next to the shown / total counter and the
M hidden chip.
-
Pick the environment in the first control of the run bar (see Selecting the Target Environment). Run Selected stays disabled until you do, and the picker is outlined until then.
-
Pick the model — Opus is the default everywhere, UI and API. Sonnet is faster but occasionally stalls on multi-step
interactflows; Haiku still resolves but is not recommended. -
Optionally pick the batch order —
Order: Auto(portal + navigation grouping, fastest),Order: Listed,Order: Reverse,Order: Shuffle. -
Optionally type a run name (≤ 120 characters). It names the batch in the report list and on the report itself; left empty, the batch is listed by its eight-hex id as before — see Giving a batch an identity.
-
Click the run button (Run N on env).
A single ticked case posts POST /api/gateway/run; two or more post
POST /api/gateway/run/batch. The body carries the chosen env plus
test_file / test_files, and optional model / dry_run / order.
# Authenticate once to get a session token.
TOKEN=$(curl -s -X POST http://ai.friendly-tech.com:8083/api/auth/login \
  -H 'Content-Type: application/json' \
  -d '{"username":"gwadmin","password":"<gateway-password>"}' \
  | python -c 'import sys,json;print(json.load(sys.stdin)["token"])')

# Run a single case on the "qa65" env.
curl -X POST http://ai.friendly-tech.com:8083/api/gateway/run \
  -H "Authorization: Bearer $TOKEN" -H 'Content-Type: application/json' \
  -d '{"env":"qa65","test_file":"C7677-network-score.yaml","model":"opus"}'
A 409 means that env’s emulator is already busy — see Selecting the Target Environment.
Other Actions
The icon-only Refresh beside the run bar reloads the list from disk (after an import or an external edit). Everything else lives in the Library menu:
-
New test case — opens the Editor’s new-case form.
-
New project — registers a project before any case lands in it. See organizing-cases.adoc#projects.
-
Import XML… — pick a file, then answer Skip existing cases (the default) or Overwrite existing cases in the dialog that follows. Takes both the agent’s own export and a TestRail one — see test-management.adoc#case-xml.
-
Sync runs… — asks for comma-separated TestRail run ids and backfills each case’s run membership (
POST /api/testrail/backfill-runs). It rewrites case metadata non-atomically, so do not run it while a batch is executing. -
Trash (N) — switches the list to the deleted cases, each offering Restore and Purge; admins also get Empty trash. See test-management.adoc#trash.
With rows ticked, a bulk bar appears above the list: Add to project…, Set section…, Find / replace…, Export XML and Delete (which moves the cases to the trash). All of them are described in Test Management.
| TestRail import and Import (upload a YAML) live in the Editor sidebar’s overflow menu, not here. Periodic TestRail refresh is handled by the background sync loop — see Auto-sync Interval. |
Selecting the Target Environment
The first dropdown of the run bar — the bordered group in the Test cases
header that reads env, model, order, run name, the run button — picks which
environment profile a run executes against: Default, qa65,
default-oracle, and so on. It carries no visible label; unset, it reads
"— select env —" and is outlined in the warning colour. Your last choice is
remembered in localStorage.
When you start a run, the gateway materializes that env’s settings (portal / emulator / ACS URLs, credentials, MCP endpoints) onto a free worker container and schedules the run there. The env is not tied to a fixed worker — unless an admin has pinned one to it, in which case that env runs only there and that worker serves only that env (see gateway.adoc#workers).
One env per emulator at a time
The scheduler is env-exclusive with an emulator mutex: each run holds a lock
keyed on the env’s physical emulator backend (its emulator_url), not the env
name. Consequences:
-
Starting a second run on an env whose emulator is already busy returns
409. Retry once the current run finishes. -
Two different envs that share one emulator are mutually exclusive — they collide on the same device serial.
-
Envs on distinct emulators run in parallel.
If every worker is occupied you instead get 503 — All workers busy.
Runs
The section holds three things: the report of whatever run you opened, the full run history, and the batch reports.
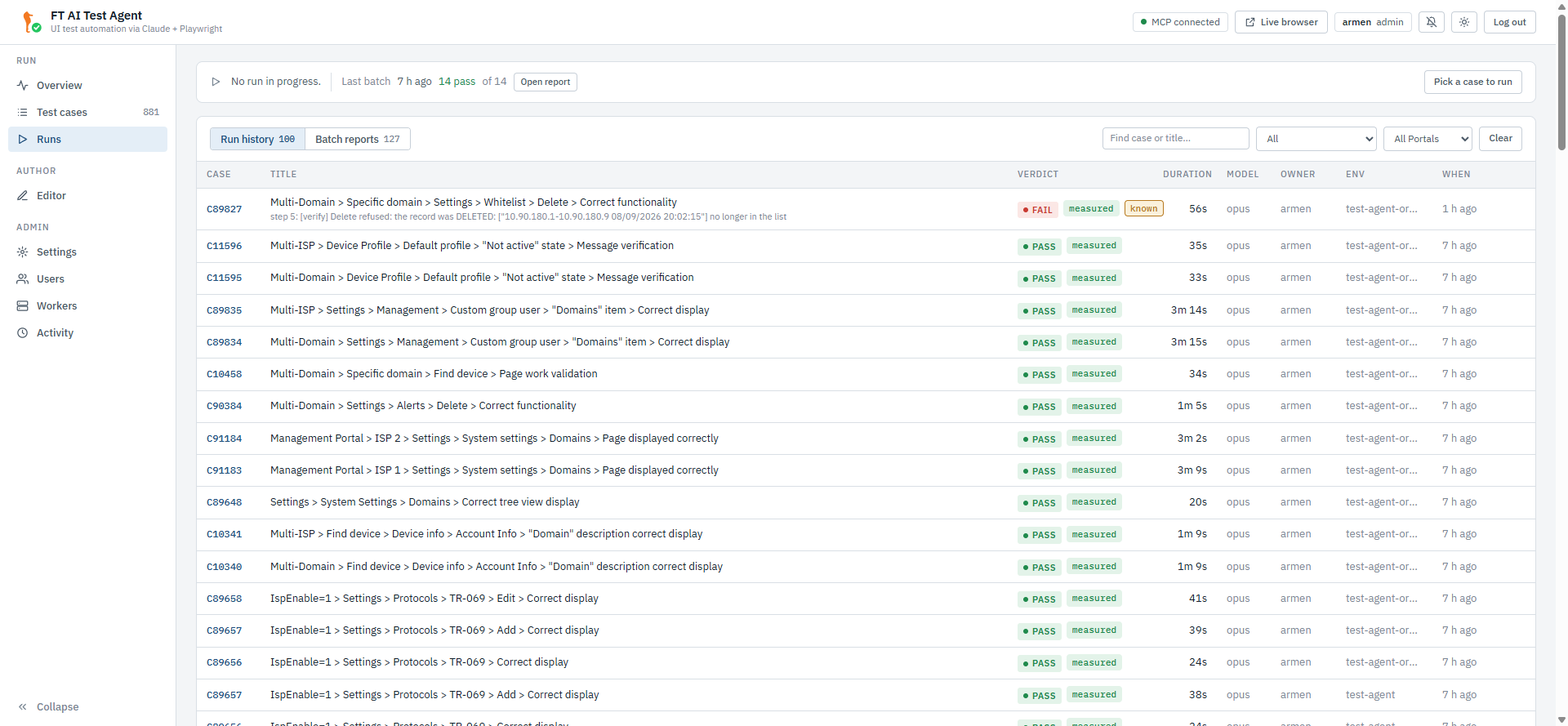
Run History
Run history and Batch reports are a segmented control inside one card; your choice is remembered.
The history header carries a search box (case or title), a verdict
filter — All / Pass / Pass · not measured / Fail /
Inconclusive / Error / Blocked — a portal filter, and Clear.
The table is Case | Title | Verdict | Duration | Model | Owner | Env | When.
Under the title of any non-passed run sits its reason. The verdict cell carries
the status pill, the judge tag and the known badge. Clicking a row opens the
report panel.
The list is paged on the server, 100 rows at a time; Show 100 more appends the next page. The search and the filters are applied by the worker over everything you may see, not by the browser over the page it happens to hold, so a case whose row sits on the fourth page is still found from the search box.
| Clear drops the run buffer and the per-run JSON, including the failure screenshot and failure-tree sidecars. It fans out to every worker as you, so it clears your runs wherever they landed — and it names any worker it could not reach, whose runs therefore stay. It spares a live batch’s runs and never touches archived batch reports — those are managed only from the Batch reports view. |
The gateway merges the workers' histories owner-scoped to you and pages
the merged list; it cannot page deeper than 1000 rows, because that is the
prefix each worker is asked for. Older runs are still on the worker’s
run-reports volume, reachable by their own #run/<id> link.
|
Batch Reports
Archived batch reports, persisted as run-reports/batch-<id>.json on the worker
that ran them. The gateway merges them owner-scoped to you. The table is
Name | Started | Model | Total | Pass | Fail | Error | Inconclusive | Blocked
| Duration | Env | Build | Owner; the Name cell falls back to the batch id
and carries the project / section underneath.
The header of that view also has Import XML — take a run exported from another stand (or another install) back in as a report of your own — plus Refresh and Clear all.
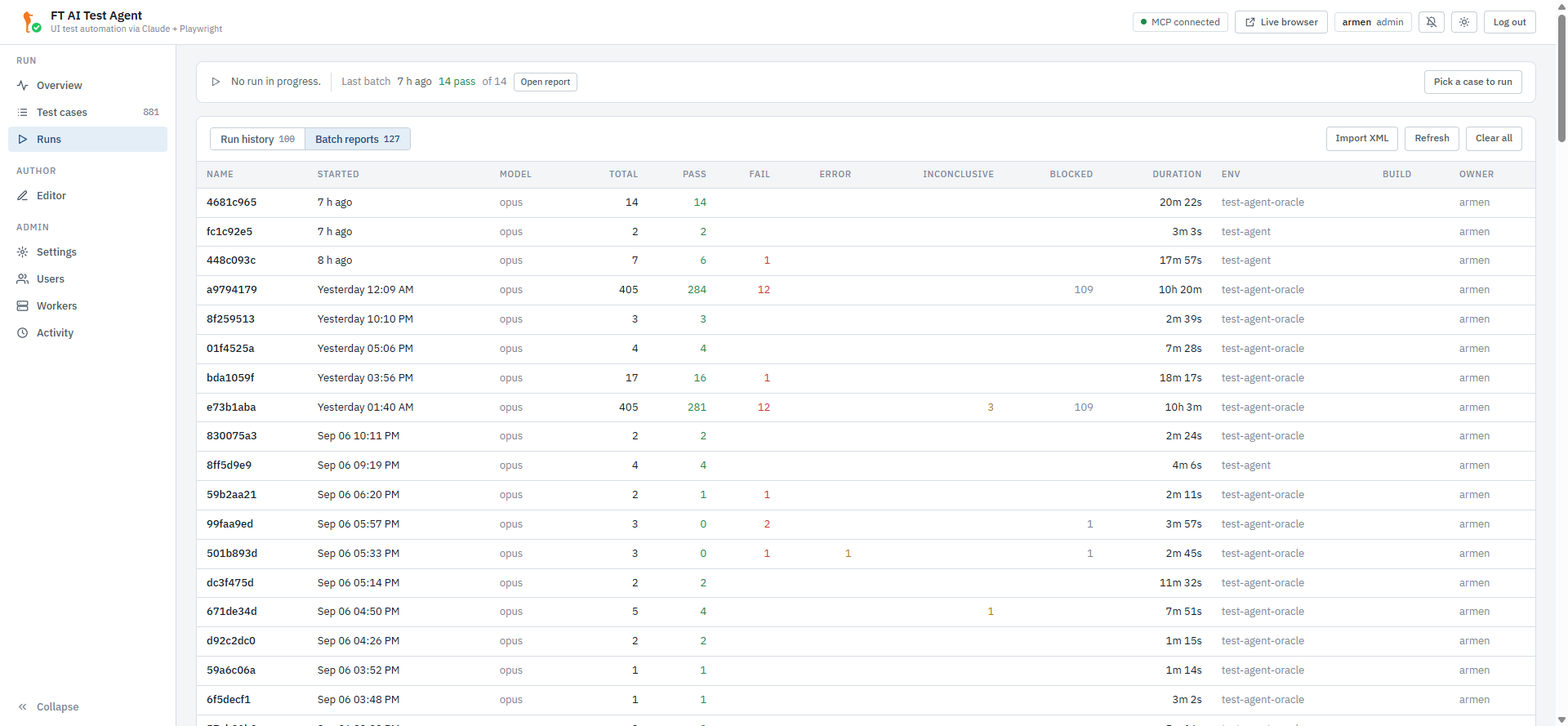
| The Build column is empty on every batch that ran before the portal build stamp existed; it fills in from the first wave started after that. See test-management.adoc#build-version. |
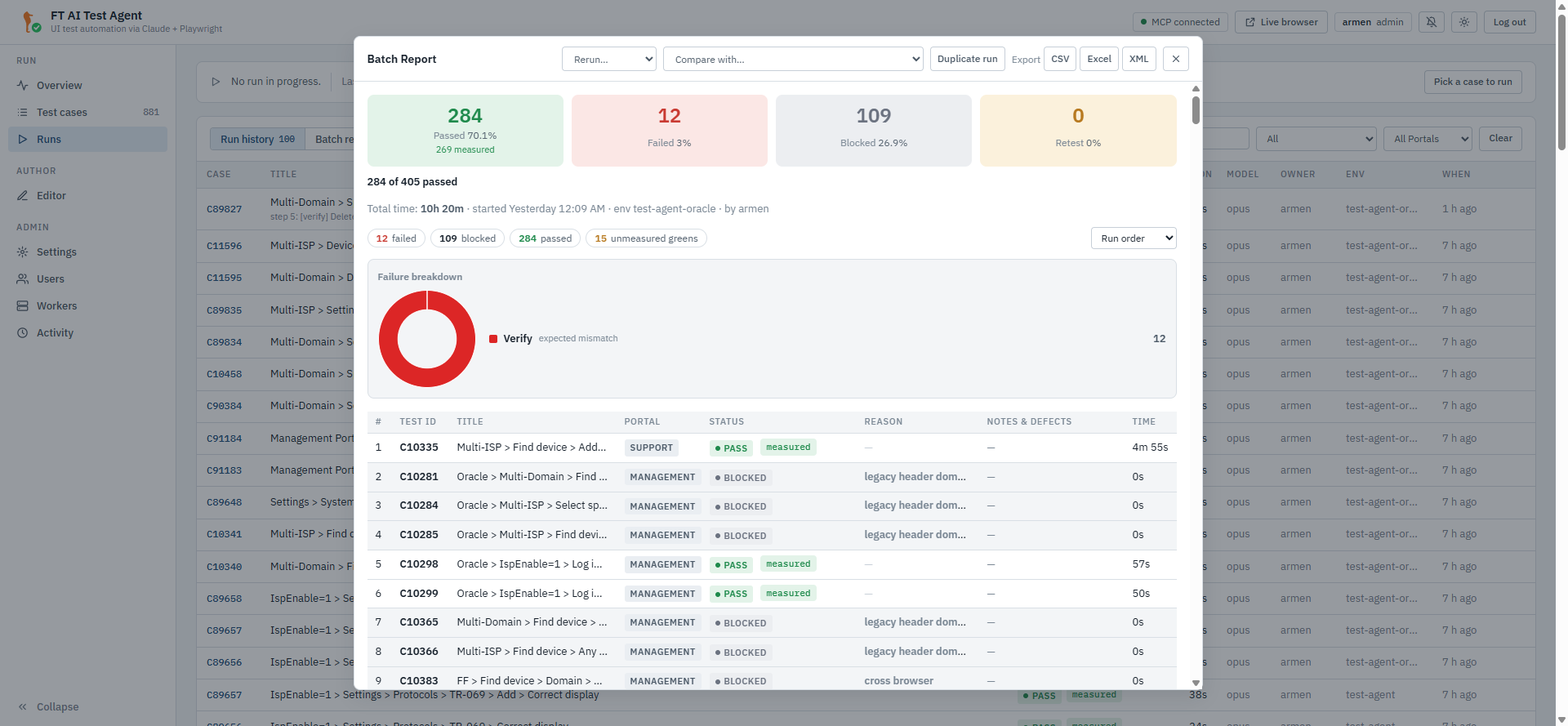
Opening a report gives the Batch Report dialog:
-
Four summary tiles — Passed (with "n measured" underneath), Failed, Blocked and Retest, each with its share of the whole wave; under them the headline
12 of 20 passedand, when the wave has any, then blocked and m skippedsplit. Then the total time and the line naming when, where, against which build and by whom the batch ran. The buckets are computed on the server — see test-management.adoc#run-stats. -
Verdict chips —
failed,errors,inconclusive,blocked,passedandunmeasured greens, each with a count and each shown only when that count is not zero; clicking one cuts the table to it. Beside them an order select: Run order, By status, Slowest first, By case id. -
Compare with… — pick an earlier batch and the report grows a diff strip:
newly red,newly green,now inconclusive,now blocked,measured now,measurement lost,only in this batch,only in the other,unchanged. Clicking a chip filters the table; the status cell gains a dashedwas <verdict>chip. -
Rerun… — start a new batch from this report’s own cases:
failed(which includes the errors),inconclusive,failed + inconclusive,blockedorall. It runs on the env currently selected in Test cases. -
Duplicate run — the same case list again as a new wave named
Copy of <name or id>, pointing back at this report. -
Edit run — add or withdraw cases while the wave is still moving; offered only while it is. See test-management.adoc#run-edit.
-
Failure breakdown — a doughnut over
Setup(emulator/preflight),Timeout(CLI/MCP/Playwright),Nav,Verify,Converter,StoppedandUnknown.An inconclusiverun is deliberately given no category, so it never appears in this breakdown. Read the Retest tile, not the doughnut. -
Results table —
# | Test ID | Title | Portal | Status | Reason | Notes &
defects | Time
, the status cell carrying pill + judge +known(+retried, +was …while a comparison is open). Clicking a row opens that run’s report; the pencil in Notes & defects edits that row’s comment and defect keys in place. -
Export — CSV, Excel and XML, all three built by the server so they carry the same columns as the printed report.
-
Comments — a panel at the bottom of the dialog for what the wave is worth saying about it.
Names, comments, defect keys, the exports and the in-flight edit are all described in Test Management → Naming, Commenting and Exporting a Run.
The Run Report
The report is one component with two homes: in the flow above the history while
a run is live, and as a side panel over whatever section you opened it from
otherwise. It is a real dialog — Esc closes it, Tab is trapped inside, and
focus returns to the row you came from. Its deep link is #run/<id>, so a
report can be pasted into a chat and opened directly.
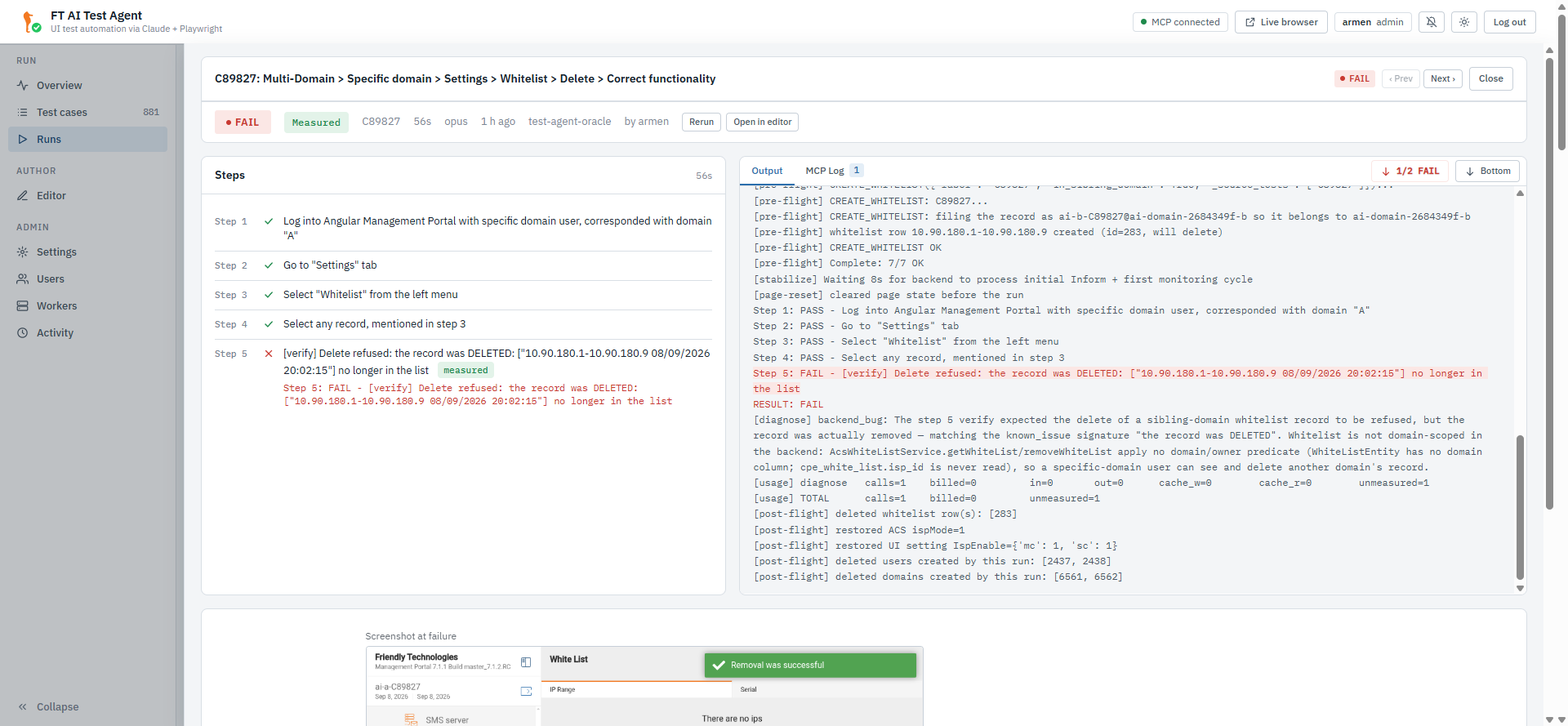
Header
Case id and title, the batch position, the status pill, and:
-
‹ Prev / Next › — walks the neighbours: the rows of the batch report if you came from one, otherwise the filtered history.
-
Force stop — for a live run (see Force Stop).
-
Run anyway (force) — for a blocked case: start it despite the missing precondition.
-
A PAUSED n/total — quota resumes HH:MM pill while a batch is waiting out the Claude usage limit.
While a run is live the header also shows the phase stepper — Load → Pages → Execute → Parse → Done — a progress bar over the steps, and, for a batch, a five-colour bar with counts, an ETA and a foldable Queue listing what is still to come.
That batch strip belongs to the wave that is moving: it goes as soon as the wave ends, whichever way the end is noticed, and starting a single case clears any strip left over from a finished one.
Up to the 2026-09-09 build only the WebSocket result of the last run put
the strip away — and a blocked case never opens a socket, so a wave that
ended on one (e.g. C10793 + C10791) kept 2 / 2 · 2 blocked and its Queue
button on screen over every run that followed.
|
Report Bar
For a finished run: the big status pill, the judge tag, a known: <bucket>
badge if the registry already explains this red, the case id, elapsed time,
model alias, when it ran, the env it ran against and its owner. Then:
-
Rerun — the same case on the currently selected env.
-
Open in editor.
-
TestRail ↗ — the original case.
-
Earlier runs — up to eight pills with this case’s previous verdicts, so a flap is visible without leaving the panel.
Steps
One row per step: a mark, the description, the judge tag, and — for a failure — the runner’s own verdict line inline.
| Mark | Status | Meaning |
|---|---|---|
✓ |
pass |
The claim was satisfied. |
✗ |
fail |
The claim was measured and did not hold. |
− |
inconclusive |
Not measured — the claim was not decided from what was captured. |
− |
skip |
Skipped after a hard failure. |
● |
executed |
The script walked past this step; its verdict lands when the segment returns. |
○ |
pending |
Not reached yet. |
⟳ |
running |
In flight. |
A step description beginning [not measured] names the reason the evidence gate
downgraded it. [verify], [polling] and [empty-state] mark a deterministic
measurement, which the gate never downgrades.
Output and MCP Log
Two sub-tabs on the right:
-
Output — full agent stdout: Claude reasoning, retries, pre-flight and post-flight lines, verifier diagnostics.
-
MCP Log — every Playwright MCP call with its arguments, colour-coded by tool (navigate / click / type / snapshot / run-code). Since 2026-09-03 the log is saved onto the report, so a report reopened days later still has it (capped at 5000 lines, with a dropped-count banner).
The bar above them has Jump to FAIL — 3/12 FAIL — which scrolls to the
next failed or inconclusive verdict line and tints every one of them; a red
report jumps to its first failure automatically. Bottom jumps to the latest
line.
Failure Artifacts
When the run produced them:
-
Screenshot at failure — the viewport at the first failing step. It appears under that step in the step list. Click it to enlarge it. The caption says if the runner took it during the step or after the run failed. The runner captures it once per run, on by default. It is the cheapest first look at a red.
-
Download failure tree — the device’s parameter tree at the moment of failure, useful for TR-181 and scoring cases. On by default for runs that applied parameters to the emulator.
-
Generate drafts — for
EXPLORE-runs only: turn the survey into proposed QA cases. The Drafts section they land in is hidden from the sidebar in the shipped UI; its#draftsroute still opens it.
Force Stop
Force stop hard-kills the underlying Claude CLI subprocess and tears down
the MCP connection for that run. The case is recorded as error with
"Stopped by user".
Force stop is owner-scoped. POST /api/run/stop fans out to every worker as
the calling user, and each worker stops only that user’s run — it is a no-op
on runs you do not own. Admins can stop any run.
Batch Runs
When you tick more than one case, the whole batch is dispatched to a single worker and queued sequentially there (no parallelism within a batch — the cases share that worker’s Chromium and emulator).
A batch is running / paused / stopped / completed / error. Its report
is persisted as run-reports/batch-<id>.json on the worker and is visible from
the Batch reports view; the deep link is #batch/<id>.
To trigger a batch programmatically, post to the gateway with the chosen env
(model, dry_run, order, name, project, section and source_batch
are all optional). Reuse the $TOKEN from Test Cases:
curl -X POST http://ai.friendly-tech.com:8083/api/gateway/run/batch \
  -H "Authorization: Bearer $TOKEN" -H 'Content-Type: application/json' \
  -d '{
    "env":"qa65",
    "test_files":["C7677-network-score.yaml","C7722-de-mesh.yaml"],
    "model":"opus",
    "name":"nightly smoke"
  }'
409 means the env’s emulator is busy; 503 means no worker is free. Draft and
explore files are dropped from the request and reported back as
skipped_drafts.
To poll batch status:
curl -H "Authorization: Bearer $TOKEN" http://ai.friendly-tech.com:8083/api/run/batch
curl -H "Authorization: Bearer $TOKEN" http://ai.friendly-tech.com:8083/api/run/batch/report
# Cross-account, deliberately not owner-scoped — this is what the wave card reads:
curl -H "Authorization: Bearer $TOKEN" http://ai.friendly-tech.com:8083/api/run/batch/summary
To stop a batch (or any active run): Force stop in the UI, or
POST /api/run/stop — it stops only your run. Deleting runs does not stop
a batch.
A batch’s membership is no longer frozen at the POST that started it:
PATCH /api/run/batch/{batch_id} with {"add": […], "remove": […]} edits
the queue while the wave is running or paused — see
Editing a Run in Flight.
Live Browser (VNC)
Each worker runs Chromium inside Xvfb with x11vnc + noVNC. The noVNC stream is
gateway-proxied and owner-gated — the old direct :6080/vnc.html host port
has been removed.
Click Live browser in the header. The SPA calls POST /api/live/ticket,
which returns the worker running your own run or batch together with a
one-time ticket for its stream, then opens that worker’s noVNC through the
gateway in a new tab:
http://<gateway>/novnc/<stand>/vnc.html?ft_view=<nonce>#path=novnc/<stand>/websockify?ticket=...&autoconnect=1&reconnect=false
(ft_view only makes each URL new, so the tab reloads when it is re-pointed;
the gateway forwards no query string to the worker.)
-
The ticket, not your session token, opens the stream. It is bound to your account, role and that worker, expires after 60 s (
GATEWAY_LIVE_TICKET_TTL; a value outside (0, 300] falls back to 60) and works once: the tab’s URL is worthless as soon as the view has opened, so a link copied out of it (or pasted into a chat) opens nothing. It rides in the#part of the URL, so loading the page sends it nowhere; it reaches the gateway only in the WebSocket request that spends it, and the worker never sees it. An unknown, spent, expired or wrong-worker ticket is refused with4401, as is one whose account was disabled, deleted or given another role in the meantime; the session token in the URL is no longer accepted at all. -
One click, then the tab follows your runs. Because the ticket works once, noVNC’s Connect / automatic reconnect cannot bring a closed view back, so the SPA does it: whenever a new run or batch of yours starts, it asks for a fresh ticket and points the same tab at the worker that run landed on. The cases of one batch do not reload the view (the gateway keeps it open between them). The header shows Live: following your run or Live: waiting for your next run; closing the Live browser tab, taking it to any other page, the × on that chip, or logging out stops following. It is kept per browser tab: it survives a reload of the page as long as the Live browser tab is still open on its view (a closed tab is never reopened without a click), and it does not carry over to a new tab or another account. The SPA notices a new run while its own tab is on screen or when it started the run itself; a run started elsewhere while the SPA sits in a background tab is picked up when you return to it.
-
You must own an active run on that stand, or a running batch. The websockify WebSocket is owner-gated server-side (
4403 "not your run"), so you can never watch another account’s session. Ownership is checked when the ticket is issued and again when the stream connects. -
The gate is re-checked while the view is open: every 10 s (
GATEWAY_NOVNC_WATCH_INTERVAL) the gateway asks the worker whether you still own an active run or a running or paused batch there. Once the worker answers that you own neither, the view is closed with4403 "run ended", i.e. within about 10 s of your run or batch ending. If the worker does not answer, the view is closed only after 2 such checks in a row (GATEWAY_NOVNC_WATCH_MAX_MISSES), so a brief worker hiccup does not cut you off. Neither the gap between two cases of your batch nor a quota pause closes it: the batch keeps its worker until it ends. -
With no running test of yours, the button opens a tab that waits for your next run.
The VNC session is read-only-ish — you can click and type, but doing so races with the running test.
| When no run is active the browser still holds the last test’s session state. Clicking around breaks nothing, but log out before the next batch — some cases assume a fresh session. |
Staying Informed Without Watching
-
Browser tab title —
12/406 · 3 fail · FT AI Test Agentduring a batch,▶ C7580 · FT AI Test Agentduring a single run. -
Desktop notifications — opt-in via the bell in the header; they fire only while the tab is in the background, for a finished run and a finished batch. They need a secure context: on plain HTTP the UI spells out the Chrome flag that whitelists this origin.
-
Keyboard —
/focuses the current section’s filter,Esccloses the topmost dialog,?toggles the shortcut list.
Inspecting Old Runs
GET /api/runs returns one page of your runs (admins see all), merged across
workers, newest first. It takes limit (default 200), offset, q (case id or
title), status, portal and test_id — the last an exact case id, which
is what the Editor’s Execution history panel asks for. Each row:
{
  "id": "8f2c…",
  "test_id": "C7677",
  "title": "…",
  "portal": "management",
  "owner": "armen",
  "status": "passed|failed|inconclusive|error|blocked",
  "error": "",
  "reason": "…",
  "judge": "programmatic|keyword|llm|none",
  "elapsed_ms": 42031,
  "model_alias": "opus",
  "environment": {"base_url": "…", "emulator_url": "…", "portal_build": "…"},
  "date": "2026-09-05T20:12:31Z"
}
status is the verdict, not the process state: a finished run reports what its
report said, a run that never started reports blocked, and anything that ended
badly reports error. environment is the stamp the run was executed against —
an object, empty on runs recorded before the stamp existed.
The list response carries no nested report and no phase. Fetch
GET /api/runs/{run_id} for the full report — that is where steps, mcp_log,
failure_screenshot_file and failure_tree_file live. mcp_log is withheld
while the run is still running.
For older runs, the JSON files under /app/run-reports/ survive container
restarts (mounted volume).