User Guide
This guide walks through the day-to-day usage of the AI Test Agent from the QA engineer’s perspective. If you want a deep field-by-field reference for the in-browser test editor, jump to Editor Guide.
|
At a glance
|
Logging In
The :8083 endpoint is the gateway: it requires a login before the UI loads.
-
Open http://ai.friendly-tech.com:8083/. A login overlay appears.
-
Sign in with your account. On a fresh deployment the only account is the bootstrap admin
admin/admin— change that password immediately (Users tab, admin only). -
On success the gateway issues a bearer-token session (kept in the browser); every API call carries it. After ~5 failed attempts in a minute the login is rate-limited (HTTP 429); a wrong username/password returns HTTP 401.
-
Your role (admin / editor / viewer) decides which tabs and actions you see — see Accounts & Roles.
| Roles in one line — a viewer can browse and read reports but cannot run or edit; an editor can author and run tests but cannot see the admin-only Settings, Users, Workers and Activity sections; an admin sees everything. |
Opening the UI
-
After logging in, the UI brands itself as FT AI Test Agent in the header, with a left sidebar carrying the sections. (Until 2026-09 these were tabs across the top; the names changed with the move.)
-
The sidebar has two groups, three for an admin:
Group Sections Run
Overview (KPIs and recent runs), Test cases (the landing section), Runs (history, batch reports and the run report).
Author
Editor.
Admin
Settings, Users, Workers, Activity — admin only.
Three screens are deliberately not in the navigation — Drafts, Learning and Procedures. They are still in the product and still work; each is reached by its hash link (
/#drafts,/#learning,/#knowledge). See troubleshooting.adoc#missing-section.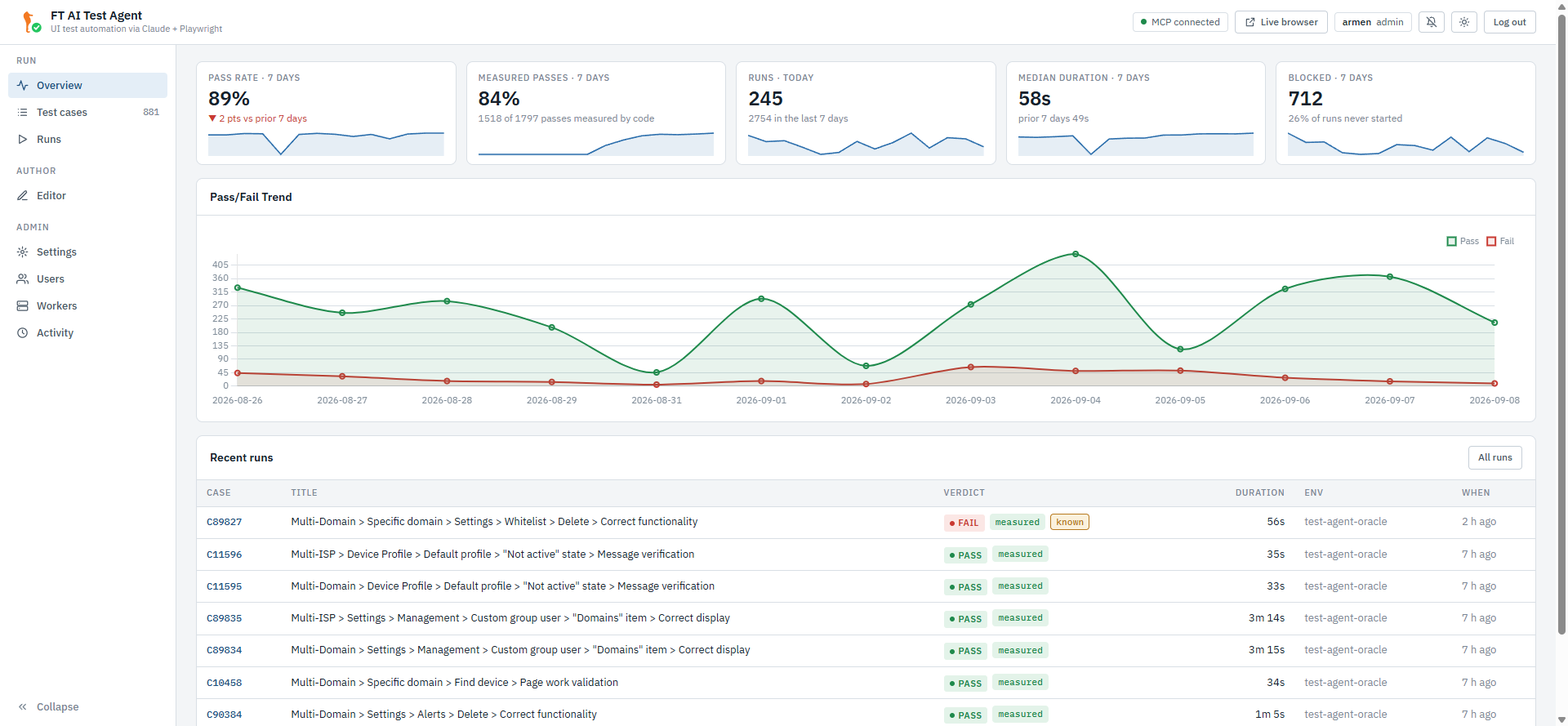
-
The header shows the MCP-connection chip and the env that your next run uses. It also has Live browser, your account, a notifications bell, a light/dark theme toggle and Log out. Until you use the toggle, the theme follows your operating system. The sidebar collapses to icons. Every section has a hash link. Paste
#run/<id>,#batch/<id>,#editor/<case id>or a filtered#tests?…link to a colleague. -
The Learning screen (
/#learning, not in the sidebar) is where the agent’s self-learned navigation fixes and recurring-failure signatures wait for a human to Accept (promote) or Dismiss — nothing is applied automatically. -
First-time setup: an admin opens Settings and verifies the base URLs and credentials, or — more commonly now — defines reusable environment profiles so anyone can pick the target env per run (see Picking the Environment Per Run). The defaults target
test-agent.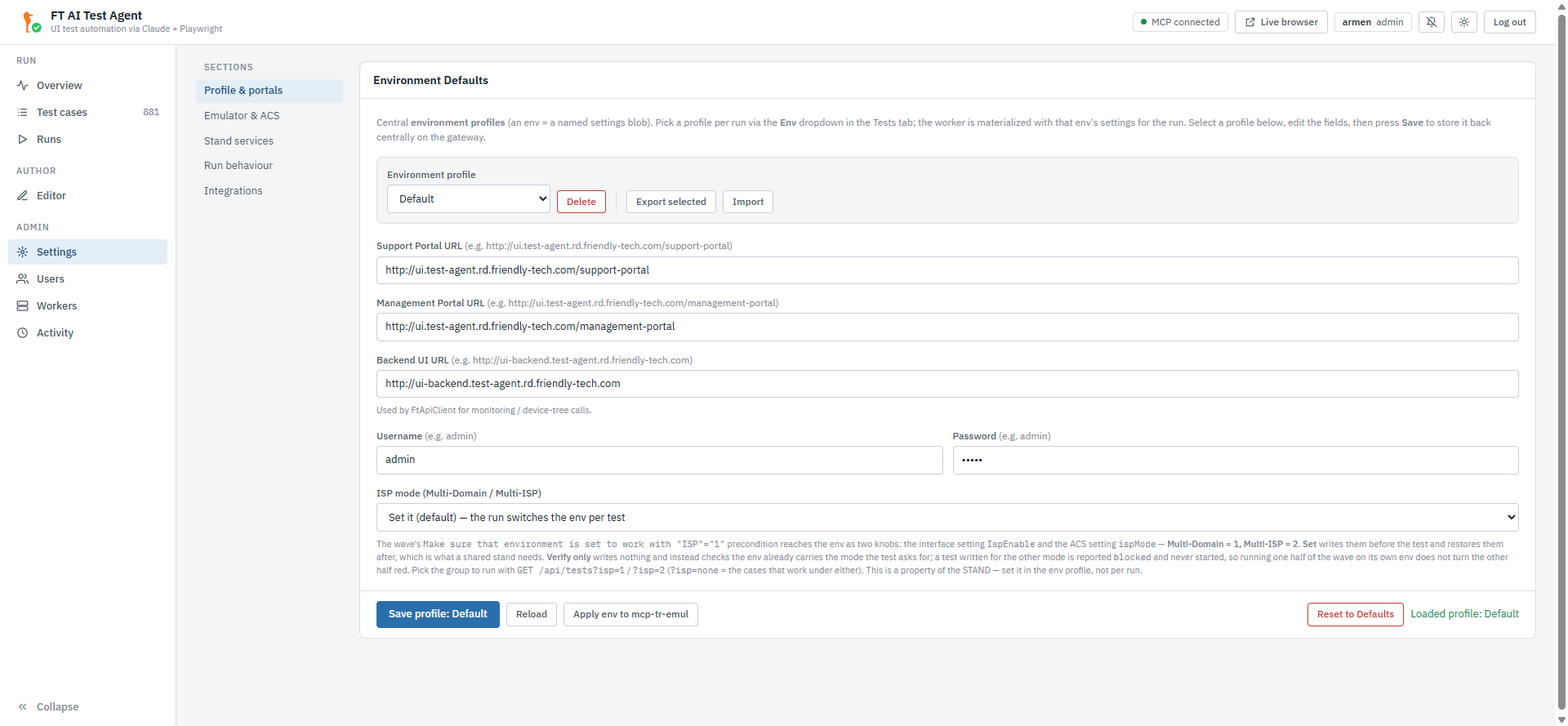
Picking the Environment Per Run
You no longer retarget the agent by editing all four Settings URLs. Instead, an
admin defines named environment profiles once, and every run picks its target
from the environment dropdown that opens the run bar in the Test cases header
— the first control of that bar, reading — select env — until a profile is
chosen. It carries no visible caption; screen readers announce it as
"Environment". Your choice is remembered in the browser (localStorage) so the
next run defaults to the same env. Each env carries its own portal / backend / emulator / ACS URLs and
credentials, and the gateway routes the run to a worker bound to that env.
See Multi-Stand Gateway → Selecting an env for how profiles map to workers, and the busy/409 behaviour when an env is in use.
The Test Cases Header
Everything you need to start a run sits in one header, and the tour is worth a minute because the controls are grouped by job, not by type.
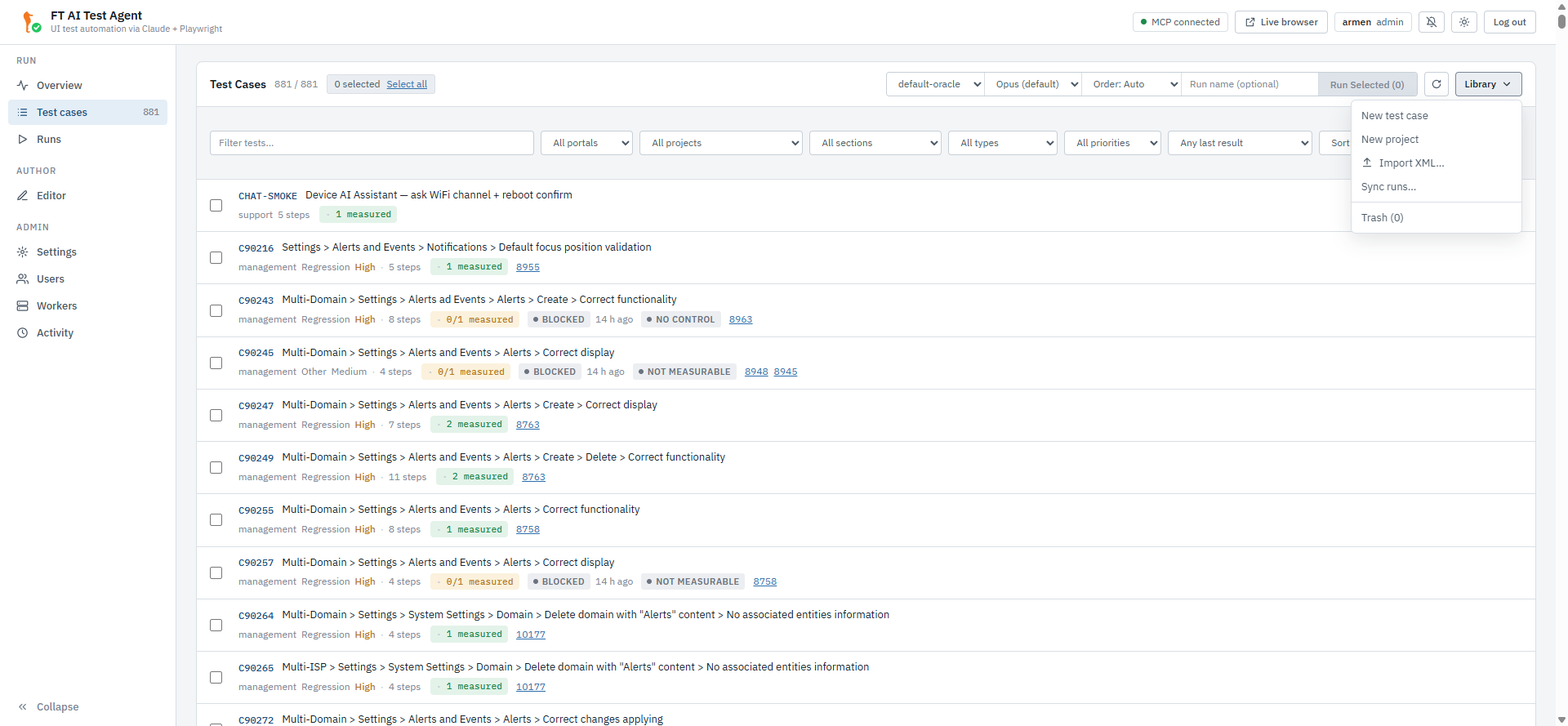
Top row — what is on screen, and what a run of it would be.
-
The title, then a counter reading shown / total. A project or run filter can quietly cut an 879-case corpus down to 287, and this is where you see it.
-
A selection pill: N selected, with Select all (every case currently shown) and — only once something is ticked — Clear.
-
The run bar, read left to right: the environment, the model, the batch order (Auto / Listed / Reverse / Shuffle), an optional run name, and Run Selected (N). The button stays disabled until an env is picked and at least one case is ticked — and while one of your runs is still going.
-
An icon Refresh that re-reads the case list.
-
A Library menu for housekeeping the corpus: New test case, New project, Import XML…, Sync runs… and, after a separator, Trash (N). Everything that creates or removes cases lives here, off the line that starts a run. A viewer account sees only Trash — the way in is not hidden, because hiding it would hide that a delete is undoable.
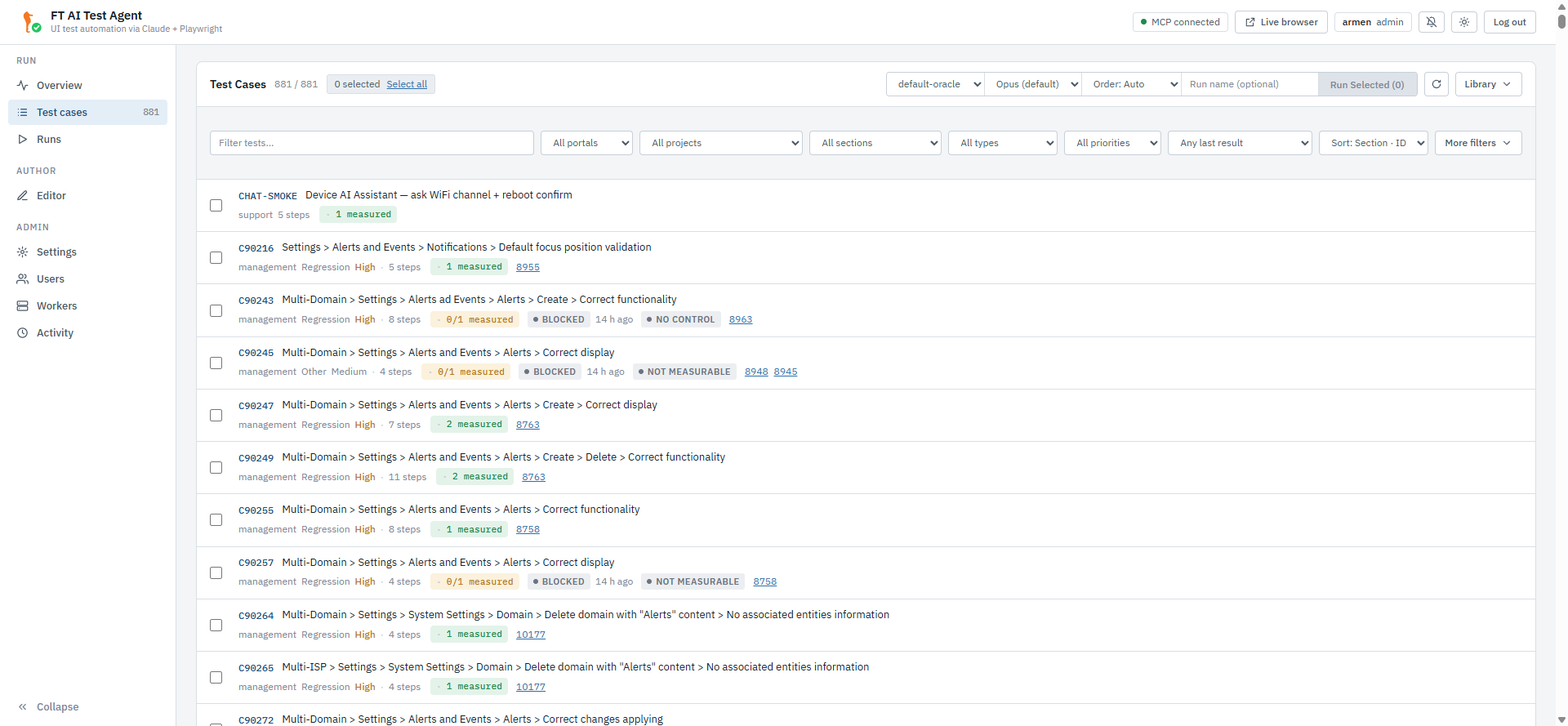
Second row — what is listed. A search box, then the filters an operator reaches for on every visit: portal, project, section, type, priority, the verdict of the case’s last result, and the sort order. Reset filters appears once any of them is set. The three rare ones — ISP mode, TestRail run and claims — are folded behind More filters, which carries a count so a filter set on the hidden row can never narrow the list unseen. Narrowing anything on this row — a filter or the search box — also drops the cases it hides from the selection, so Run Selected (N) can only start what you can see.
Bulk bar. Ticking rows adds a bar with the actions that operate on the selection — Add to project…, Set section…, Find / replace…, Export XML and Delete — and it disappears with the selection.
The full reference for this screen is Running Tests → Test Cases; the trash, duplicates and bulk edits are in Test Management: Trash, History, Attachments & Run Reports.
Four Common Workflows
The agent supports four end-to-end flows. Most QA work falls into one of them.
Workflow A: Import → Run
Use this when there is already a TestRail case and you just need to execute it.
-
Open the Editor, click the ⋯ button above the case list and choose TestRail…. The import modal opens.
-
Choose one of three:
-
Project → Suite → Section → Preview → tick the cases to import, OR
-
Import TestRail run — a run id pulls its whole case set and labels it, OR
-
Import single test case — one case number (e.g.
7677).
-
-
The converter runs server-side: downloads the attached XML tree, extracts steps, enriches with LLM, generates
emulator_setup. The modal reports Created / Skipped / Errors when the job finishes. -
Go to Test cases, find the case (use the search box or the filters below the header), tick the checkbox.
-
Pick the target environment in the run bar’s first dropdown (see Picking the Environment Per Run).
-
Pick the model in the next dropdown (default: Opus — recommended; Sonnet may stall on multi-step interact flows).
-
Optionally set the batch order and type a run name — both live in the same run bar, and the name is what the report is found by a week later.
-
Click Run Selected (1). The view jumps to Runs.
-
Watch the phase stepper (Load → Pages → Execute → Parse → Done), the step list filling in live, and the MCP log on the right. Live browser (top right) opens the gateway-proxied noVNC view of your run.
-
When it lands, read the verdict and its judge — see Reading a Verdict.
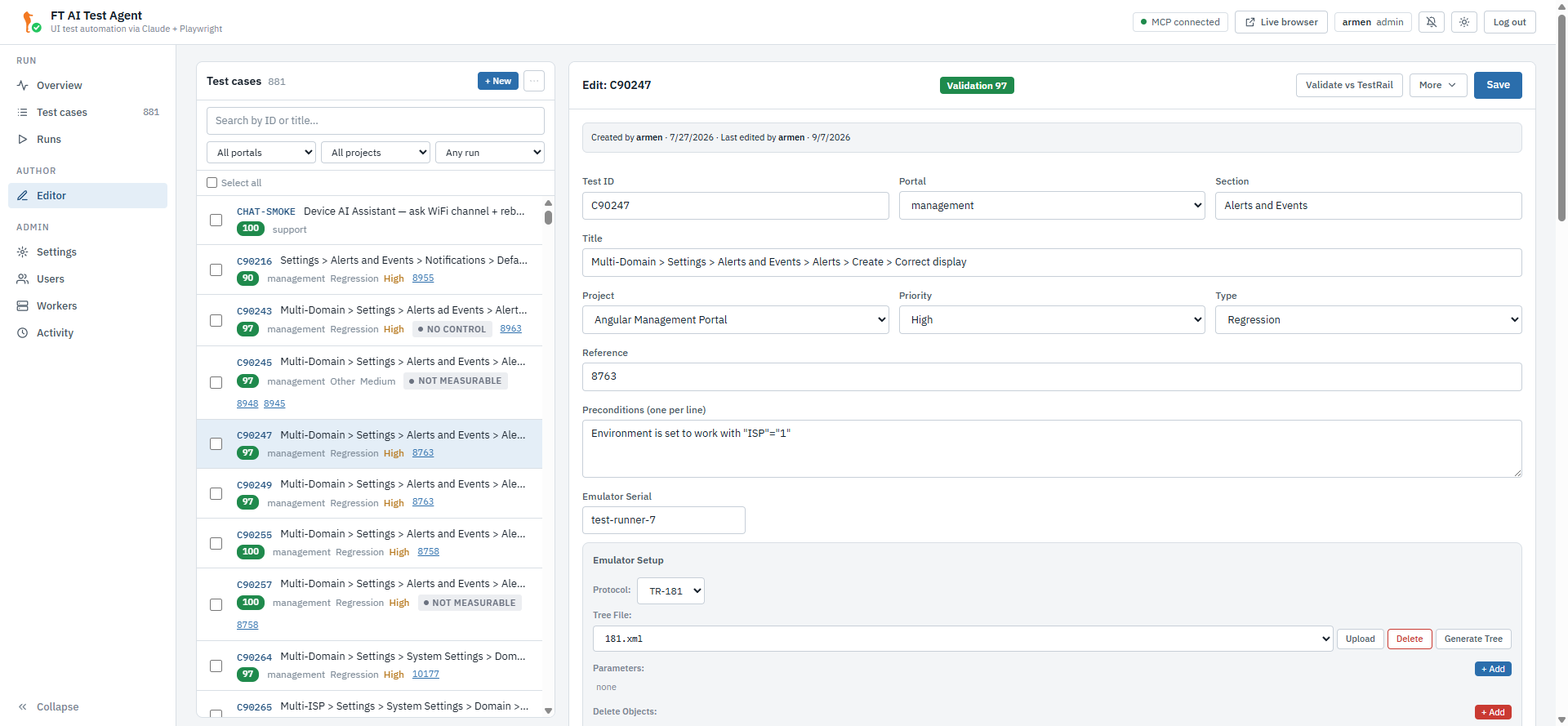
Workflow B: Edit Existing Test
Use this when an imported test fails because the converter missed something (wrong tree, missing parameter, wrong step ordering).
-
Open the Editor. The left list shows all imported cases — search by ID or title.
-
Click the case. The form populates.
-
Adjust:
-
Preconditions / Emulator Serial
-
Emulator Setup block — tree file, parameters, delete-objects, instance limits, UI preconditions, phases.
-
Steps — change the type (
navvsinteract), editaction/expected, reorder with arrows.
-
-
Click Save. Leaving with unsaved edits raises a guard dialog — there is no draft buffer.
-
To re-run: switch to Test cases, tick it, Run Selected — or press Rerun straight from the run report.
| Before changing anything, open TestRail source in the Steps header. It renders the original case beside the converted steps, which is how you see a TestRail step the converter merged or dropped. |
If you only want to regenerate emulator_setup from the test text — and keep
your manual step edits — click Regenerate in the editor’s More ▾ menu (see
editor-guide.adoc#regenerate).
|
Below the step list the open case carries three panels — its Change history (every saved version, with a diff and a restore), its Execution history (its own recent runs, clickable straight into the report) and its Attachments. They answer "what did I change" and "did the change help" without leaving the form; see editor-guide.adoc#case-panels.
Workflow C: Author From Scratch
Use this when there is no TestRail case yet, or you are reproducing a bug without official QA coverage. For conventions on writing the step text and preconditions so the converter produces a clean YAML, see Writing TestRail Cases.
-
Editor → + New (top row of the case list, beside the ⋯ menu).
-
Fill the Core Fields (Test ID, Portal, Type, Section, Title, Base URL, username/password, Preconditions, Emulator Serial).
-
Click + Add Emulator Setup to enable the emulator block (see editor-guide.adoc#emulator-setup).
-
Add steps — start with a
nav: loginstep, thensidebar,widgetetc., theninteractsteps for verification. -
Save → run it from Test cases.
Organizing Cases
Each case carries organisational metadata: Project, Section, Reference (the Jira key), Priority, Type, Author, its TestRail runs and its required ISP mode. On Test cases the list is ordered by the Sort dropdown (section · ID by default) and nine filters narrow it — six on the filter row, three behind More filters — so large suites stay navigable. Set these fields in the Editor, or have them populated on TestRail import. See Organizing Cases for the full model — including why run membership must not be read off the project label.
Reading the Overview
The Overview summarises your run history:
-
Five KPI cards — Pass rate · 7 days, Measured passes · 7 days, Runs · today, Median duration · 7 days, Blocked · 7 days — each with a delta against the previous week.
-
A pass/fail trend chart.
-
The eight most recent runs. Click any row and its report opens as a panel.
Above it, whenever a batch is in flight on any worker, a Wave in progress
card shows whose it is, on which env and worker, how far along, and the ETA.
That card — not /api/runs/active — is how you tell whether a stand is free.
The full history, the filters and the archived batch reports live in Runs. See Running Tests.
Reading a Run Report
Click a run anywhere — Overview, Runs, a case’s last-run pill, a batch report —
and the report opens as a side panel over that list. Esc closes it,
‹ Prev / Next › walks the neighbours, and #run/<id> links straight to it.
-
The status pill is PASS / FAIL / INCONCLUSIVE / ERROR / BLOCKED.
-
Beside it, the judge tag says what reached that verdict: Measured, Keywords, LLM-judged or Unverified. A pass judged by an LLM is a claim, not a measurement — see running-tests.adoc#verdicts.
-
The step list marks each step and carries its own judge and, on a failure, the reason inline. A step reading
[not measured] …is the amber case. -
The right card has Output and MCP Log, with Jump to FAIL to walk the failed verdicts.
-
Under the first failing step: Screenshot at failure — the viewport at that step. Click it to enlarge it. Look at it before theorising; it is the cheapest evidence there is.
-
The report bar offers Rerun, Open in editor, TestRail ↗, and Earlier runs — this case’s last eight verdicts, so a flap is obvious.
When to Touch Settings
Most users never touch Settings — defaults are correct for test-agent. Edit
when:
-
You need to switch the test target environment (set new portal / backend / emulator URLs).
-
TestRail credentials rotated.
-
Adding ClickHouse seeding for interference tests.
See Settings.
Common Pitfalls
| Symptom | Likely cause and fix |
|---|---|
Test was imported but emulator_setup is empty |
Tree XML was not attached to the TestRail case. Open Editor, click
Generate Tree, or set |
Test stalls in Executing for several minutes on Sonnet |
Interact loop is waiting for an element that never appears. Switch to Opus in the model dropdown of the Test cases run bar and re-run. |
Login step works, but sidebar click times out |
The portal credentials in Settings / Editor are wrong, or the base URL points
at a portal that does not match |
Dashboard shows old failures even after fixing the converter |
Ensure you reimported the case after the converter change (see importing-tests.adoc#reimport). The persistent volume keeps the old YAML. |
A run came back amber ( |
Nothing measured at least one claim: the judge quoted nothing from the
captured page, or there was no capture. Not a product failure and not a pass —
open the step marked |
A green case still worries you |
Check the judge tag and the claims chip on the case. |
I don’t see my run, or my history looks empty |
Runs are owner-scoped — you see only the runs you started (admins see all). Logging in as a different account, or as an editor/viewer, shows a different slice of history. See Accounts & Roles. |
A case came back |
Its infrastructure precondition is not available on this stand. The run is recorded, with the reason. Use Run anyway (force) in the report panel if you want it attempted regardless. |
"Env is busy" / HTTP 409 when starting a run |
Another run already holds that environment (more precisely, its emulator backend). Wait for it to finish or pick another environment in the run bar’s first dropdown. See gateway.adoc#selecting-env. |