Monitoring Architecture
Version 1.6.9-option-3 | Updated: August 07, 2026
Monitoring Architecture
SNMP Trap Flow (Granular OID Mapping)
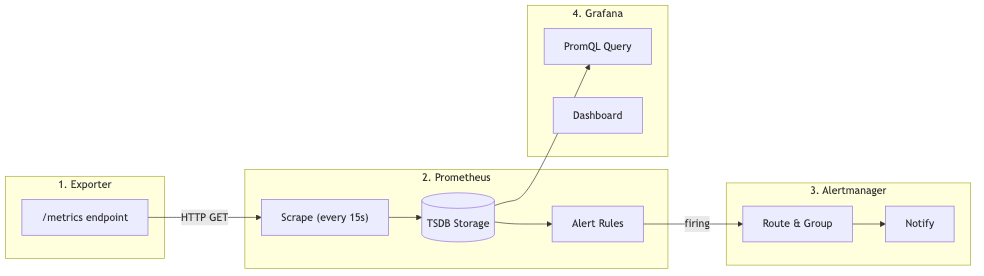
Each Prometheus alert rule has a unique oid label. When an alert fires, the flow is:
flowchart LR
    subgraph Prometheus["Prometheus"]
        RULE["Alert Rule<br/>oid: 1.3.6.1.4.1.65666.2.0.48"]
    end

    subgraph AM["Alertmanager"]
        ROUTE["Route to<br/>snmp-notifier webhook"]
    end

    subgraph SNMP["SNMP Notifier :9464"]
        PARSE["Extract oid label"]
        MIB["MIB Lookup<br/>FRIENDLY-TECH-ACS-MIB"]
        TRAP["Generate SNMP Trap"]
    end

    subgraph NMS["NMS / Receiver"]
        RX["Receive trap<br/>with unique OID"]
    end

    RULE -->|firing| ROUTE
    ROUTE -->|webhook + labels| PARSE
    PARSE --> MIB
    MIB --> TRAP
    TRAP -->|"SNMPv2c/v3<br/>UDP :162"| RX
Components:
-
Alert Rules (
prometheus_rules.yml,hazelcast_rules.yml,acs_alerting_rules.yml) — 81 rules; 36 carry SNMP OID labels across 33 distinct trigger OIDs (+ pairedoid_resolved; some OIDs shared across related alerts) -
Alertmanager — routes firing alerts to snmp-notifier via webhook
-
SNMP Notifier (
:9464) — extractsoidlabel from alert, generates SNMP trap with that OID -
MIB file (
alertmanager/mibs/FRIENDLY-TECH-ACS-MIB.txt) — maps OIDs to NOTIFICATION-TYPE definitions, mounted as external config -
OID Mapping (
alertmanager/mibs/OID-MAPPING.md) — human-readable OID reference -
Thresholds UI (
/alertmanager-config/thresholds) — edit alert thresholds without restart
OID Structure: 1.3.6.1.4.1.65666.2.0.<alert-id>
-
1.3.6.1.4.1.65666— Enterprise OID (Friendly Technologies, IANA PEN 65666) -
.2.0— ACS Notifications branch (ftAcsTraps) -
.<alert-id>— unique per alert (1-99: infrastructure, 100-200: reserved for customer)
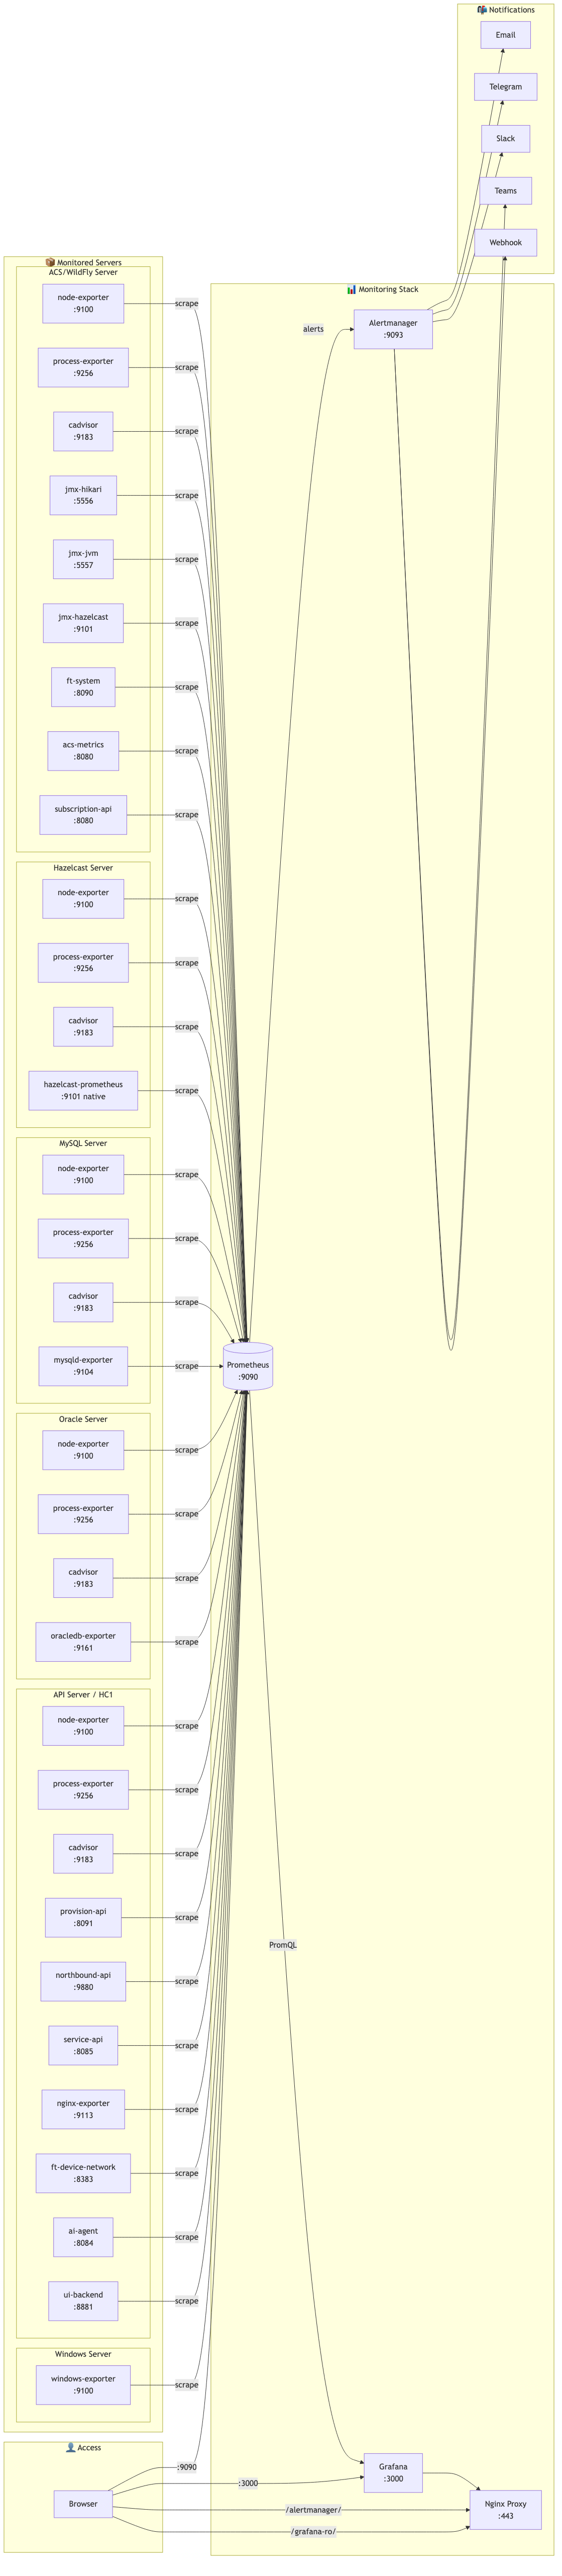
Server Types & Exporters
| Server Type | Exporters | Ports |
|---|---|---|
ACS/WildFly |
node, process, cadvisor, jmx-hikari, jmx-jvm, Hazelcast native endpoint (embedded in ACS), ft-system, acs-metrics, subscription-api |
9100, 9256, 9183, 5556, 5557, 9101, 8090, 8080 |
Hazelcast (standalone / docker) |
node, process, cadvisor, jmx-hazelcast (JMX :9110 → serves :9101) |
9100, 9256, 9183, 9101 |
MySQL |
node, process, cadvisor, mysqld-exporter |
9100, 9256, 9183, 9104 |
Oracle |
node, process, cadvisor, oracledb-exporter |
9100, 9256, 9183, 9161 |
ClickHouse |
node, process, cadvisor, clickhouse (native endpoint) |
9100, 9256, 9183, 9363 |
PostgreSQL |
node, process, cadvisor, postgres-exporter |
9100, 9256, 9183, 9187 |
API/HC1 (Angular UI) |
node, process, cadvisor, provision, northbound, service, nginx-exporter, ft-device-network, ai-agent, ui-backend |
9100, 9256, 9183, 8091, 9880, 8085, 9113, 8383, 8084, 8881 |
Windows |
windows_exporter — registered with |
9100 |
Metrics Endpoints Reference
System Exporters (Docker containers)
| servers.env TYPE | Port | Metrics Path | Description |
|---|---|---|---|
|
9100 |
|
CPU, RAM, Disk, Network (node-exporter) |
|
9256 |
|
Host process stats (process-exporter) |
|
9183 |
|
Docker container metrics (cAdvisor) |
|
9104 |
|
MySQL database metrics (mysqld-exporter) |
|
9161 |
|
Oracle database metrics (oracledb-exporter) |
|
9363 |
|
ClickHouse database metrics (native Prometheus endpoint) |
|
9187 |
|
PostgreSQL database metrics (postgres-exporter) |
|
9113 |
|
Nginx web server metrics (nginx-exporter) |
|
9100 |
|
Windows system metrics (windows-exporter) |
JMX Exporters (Docker containers)
| servers.env TYPE | Port | Metrics Path | Description |
|---|---|---|---|
|
5556 |
|
HikariCP connection pool metrics |
|
5557 |
|
JVM heap, GC, threads metrics |
Native Application Endpoints
| servers.env TYPE | Port | Metrics Path | Description |
|---|---|---|---|
|
9101 |
|
Hazelcast metrics: embedded-in-ACS via native :9101; standalone via the |
|
8090 |
|
FT System Spring Boot Actuator |
|
8080 |
|
ACS application business metrics |
|
8080 |
|
Subscription API metrics (FTACS) |
API Service Endpoints (Docker containers / Native Actuator)
| servers.env TYPE | Port | Metrics Path | Description |
|---|---|---|---|
|
8091 |
|
Provision Portal API metrics |
|
9880 |
|
Northbound API metrics |
|
8085 |
|
Service API metrics |
FT UI Services Endpoints (Docker containers / Native metrics)
| servers.env TYPE | Port | Metrics Path | Description |
|---|---|---|---|
|
8383 |
|
FT Device Network Service (Spring Boot) |
|
8084 |
|
AI Agent (Python/FastAPI with prometheus_client) |
|
8881 |
|
UI Backend (when actuator enabled in Spring Security) |
Monitoring Stack
| Service | Port | Description |
|---|---|---|
Prometheus |
9090 |
Metrics storage & query |
Alertmanager |
9093 |
Alert routing & notifications (Email, Telegram, Slack, Teams, Webhook, SMS, SNMP) |
SNMP Notifier |
9464 |
Converts alerts to SNMP traps |
Grafana |
3000 |
Dashboards & visualization |
Alertmanager Config UI |
8085 |
Web editor for notification channels, thresholds and alert rules |
Nginx |
80/443 |
Reverse proxy, HTTPS, /grafana-ro/, /alertmanager/, /alertmanager-config/ |
How the Config UI applies a change. Channel settings live in the stack .env,
not in alertmanager.yml — Alertmanager renders that file from its template in the
entrypoint, and SNMP Notifier turns its SNMP_* variables into CLI flags in the
same way. Neither re-reads .env while running, so the UI restarts them over the
mounted /var/run/docker.sock (SNMP Notifier only when an SNMP_* value actually
changed). Both the socket and the files the UI edits are reached through the host
docker group, whose gid bootstrap.sh records as DOCKER_GID. If a restart is
not possible the save still lands in .env and the UI reports which service is
still running the old settings. Full details live with the app itself, in
prometheus-grafana-stack/alertmanager-config-ui/README.md.