Running Tests
This page covers the Dashboard, Tests and Runner tabs — everything from batch trigger to live observability and post-run inspection.
The UI talks to a gateway that fans requests out to a pool of generic worker containers. You pick a target environment (env profile) per run; the gateway materializes that env’s settings onto a free worker and schedules the run there. See Environments & the Gateway for the gateway/worker model.
|
Per-account isolation. Dashboard history, |
|
At a glance
|
Dashboard
The landing tab. Aggregates the run history for the calling user (admins see all users' runs). The gateway merges the histories of every worker, owner-scoped to you, so a run that landed on any worker still shows up here.
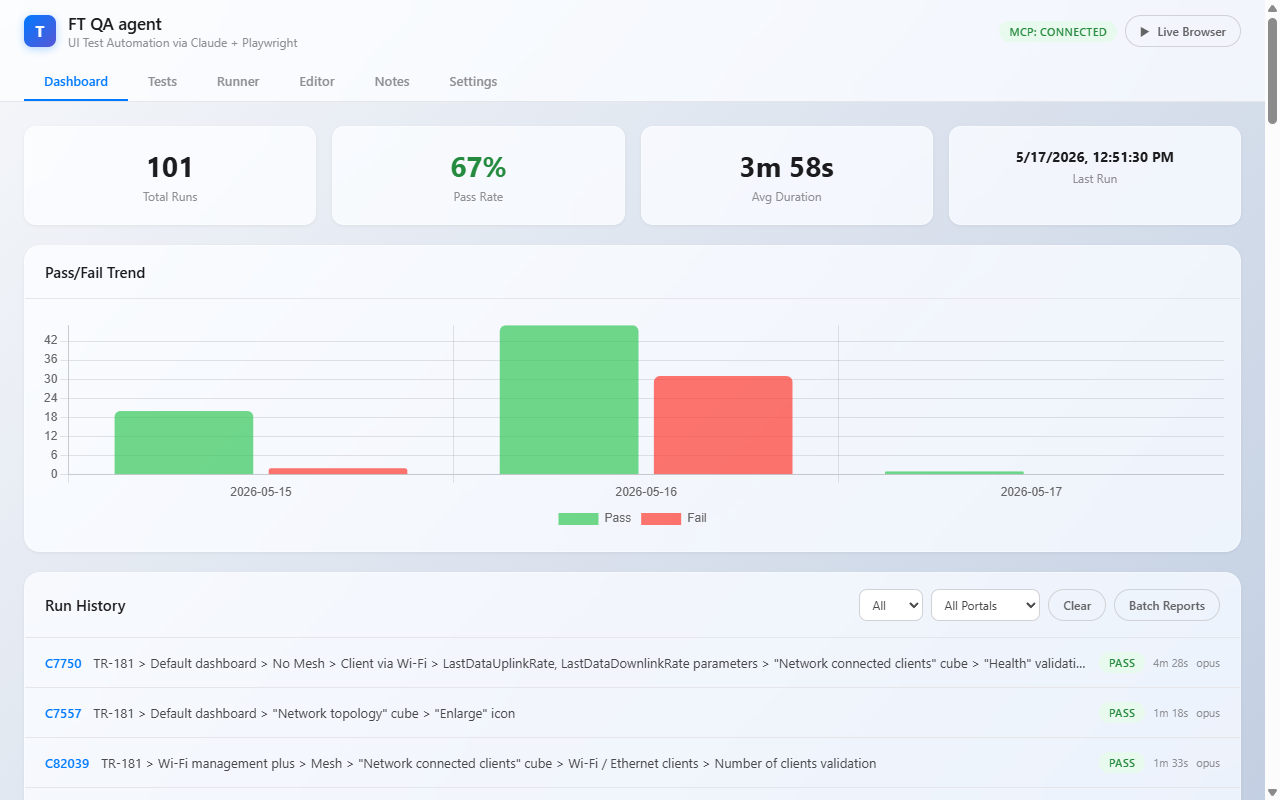
Summary Cards
Four cards across the top, computed from the runs currently held by the server:
-
Total Runs — count of recorded runs.
-
Pass Rate — percentage of
passedover total. -
Avg Duration — mean elapsed time per run.
-
Last Run — timestamp of the most recent run.
Pass/Fail Trend
A Chart.js trend chart appears below the cards once any runs exist. Visualises the pass/fail counts over time to spot regressions across batches.
Run History
Scrollable list of your runs (newest first; admins see everyone’s). Each row links to its full report — clicking opens the Runner tab pre-loaded with that run.
The header has three filters and a button:
-
Status filter —
All/Pass/Fail/Error. -
Portal filter —
All Portals/Support/Management. -
Clear — drops the in-memory run buffer (does not touch persisted batch reports on disk).
-
Batch Reports dropdown — see Batch Reports Dropdown.
Batch Reports Dropdown
Opens the list of archived batch reports persisted under
/app/run-reports/batches/ on each worker. The gateway merges them
owner-scoped to you (admins see all). Each entry shows the start timestamp,
model alias, total / passed / failed / error counts, and total elapsed time.
Click a row to open the Batch Report modal:
-
Failure-category pie chart — every failed run is bucketed into one of
setup/mcp_timeout/nav/verify/converter/stopped/unknown. Useful to spot whether a batch failed for the same reason or many. -
Results table — per-test row with status pill, elapsed time, model and failure category.
-
Export CSV — download the report as CSV for ad-hoc analysis.
The Clear All button at the top wipes archived reports (calls
DELETE /api/run/batch/reports).
Tests Tab
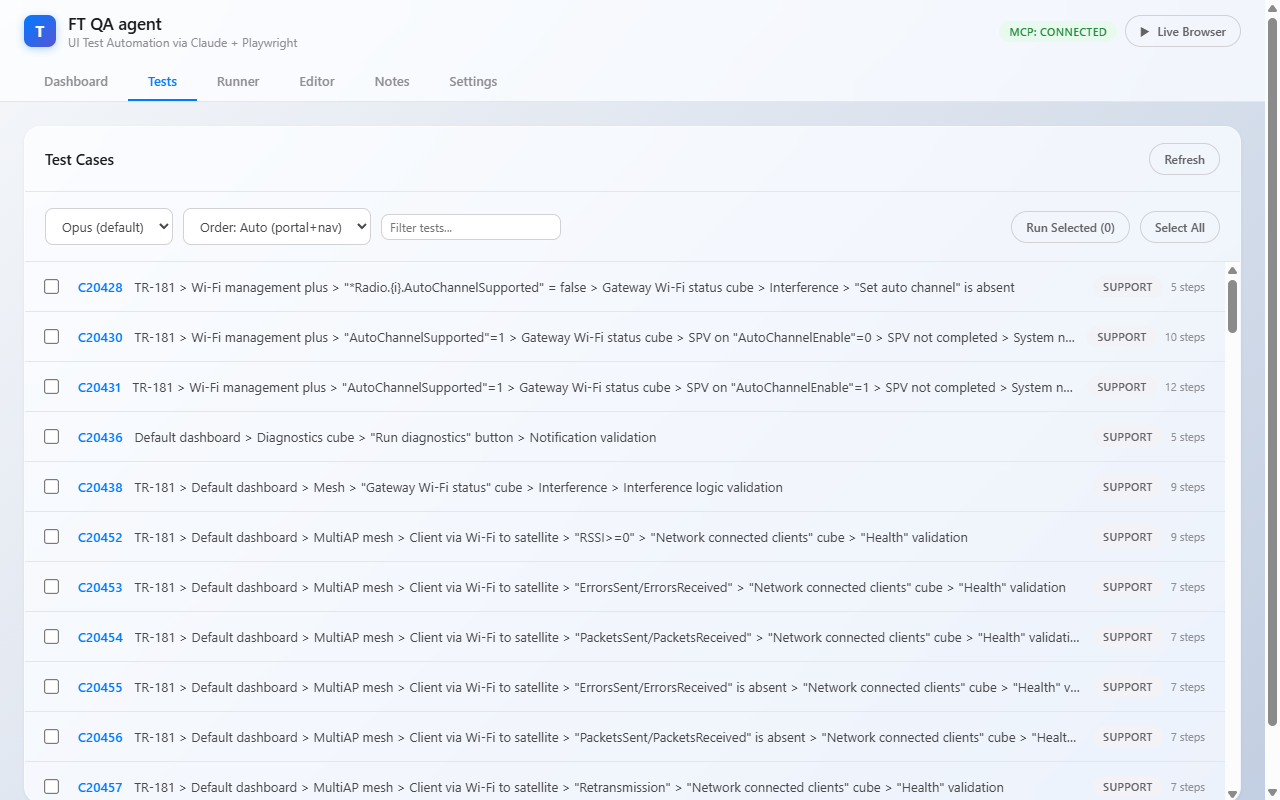
Lists all YAML files currently under /app/tests/cases/. Each row is now
two lines, so a long title is never squeezed by the metadata:
-
Top line — the
C<TestRail-id>identifier followed by the full title. -
Second line (meta) — a
support/managementportal pill, optional type and priority pills, linked Jira references, and the step count (N steps).
Filtering
Three filters sit above the list:
-
Text filter — filters by ID or title (case-insensitive substring).
-
Portal filter —
All Portals/Support/Management. -
Project filter — narrows to a single project (or
Unassigned). Cases are also grouped into sections by project. See Organizing Cases: Projects & Sections for how projects and sections are assigned.
Selecting
Tick the checkbox on the left to add a case to the run set, or click anywhere
else on the row body to toggle. The button updates with the count:
Run Selected (N).
-
Select All — ticks every visible row (filter-respecting).
-
Clear All — clears the selection (only visible when at least one row is selected).
Running
-
Pick a model (top-left dropdown):
-
Opus — default everywhere (UI and API). Slowest but most reliable for multi-step
interactloops; both/api/gateway/runand/api/gateway/run/batchresolve toopuswhenmodelis omitted. -
Sonnet — faster, occasionally stalls on complex
interactflows. -
Haiku — still a resolvable alias, but no longer recommended: it was dropped from the converter to cut jitter (see Architecture and Importing Tests). Prefer Opus.
-
-
Pick the Env (see Selecting the Target Environment).
-
Click Run Selected (N).
-
View jumps to Runner.
The button calls the gateway, not a worker directly. A single ticked case posts
POST /api/gateway/run; two or more post POST /api/gateway/run/batch. The
JSON body carries the chosen env plus test_file (single) or test_files
(batch), and optional model / dry_run / order.
# Authenticate once to get a session token (gwadmin shown).
TOKEN=$(curl -s -X POST http://ai.friendly-tech.com:8083/api/auth/login \
  -H 'Content-Type: application/json' \
  -d '{"username":"gwadmin","password":"<gateway-password>"}' \
  | python -c 'import sys,json;print(json.load(sys.stdin)["token"])')

# Run a single case on the "qa65" env.
curl -X POST http://ai.friendly-tech.com:8083/api/gateway/run \
  -H "Authorization: Bearer $TOKEN" -H 'Content-Type: application/json' \
  -d '{"env":"qa65","test_file":"C7677-network-score.yaml","model":"opus"}'
A 409 response means that env’s emulator is already busy — see
Selecting the Target Environment.
Other Actions
-
Refresh — reload the list from disk (after import / external edit).
| The TestRail import and Import YAML actions live in the Editor tab header (top-right). They are not in the Tests tab. Periodic TestRail refresh is handled by the background sync loop (see Auto-sync Interval). |
Selecting the Target Environment
The Env: dropdown on the Tests tab (right of the filters) picks which
environment profile a run executes against — Default, qa65, kira2,
kira3, and so on. Your last choice is remembered in localStorage, so it
persists across reloads. You must pick an env before Run Selected will fire.
When you start a run, the gateway materializes that env’s settings (portal / emulator / ACS URLs, credentials, MCP endpoints) onto a free worker container and schedules the run there. The env is not tied to a fixed worker — it is applied per dispatch.
One env per emulator at a time
The scheduler is env-exclusive with an emulator mutex: each run holds a lock
keyed on the env’s physical emulator backend (its emulator_url), not the env
name. Consequences:
-
Starting a second run on an env whose emulator is already busy returns
409— the emulator for that env is busy. Retry once the current run finishes. -
Two different envs that share one emulator (e.g.
Default/qa65/kira2all point at thetest-agentemulator) are mutually exclusive — they collide on the same device serial, so only one runs at a time. -
Envs on distinct emulators run in parallel (e.g.
kira3→ its ownqa11memulator runs alongside atest-agentrun).
If every worker is occupied you instead get a 503 — All workers busy.
See Environments & the Gateway for the full gateway / worker-pool / profile model.
Runner Tab
Live view of the active run. Empty placeholder when no run is in flight.
Phase Stepper
Top of the card. Shows agent state:
-
Loading — parsing YAML, loading UI map / page descriptions.
-
Pages — building system prompt with the filtered nav map and compound actions.
-
Executing — running steps. The phase pill stays here for most of the run.
-
Parsing — converting Claude output into the JSON report.
-
Done — final report assembled.
A spinner sits inside the dot of the active phase; completed phases get a ✓.
Steps Card (left)
One row per step:
Glyph |
Status |
Meaning |
✓ |
pass |
Programmatic / LLM verifier confirmed expected. |
✗ |
fail |
Verifier failed. Hover row for the failure reason. |
— |
skip |
Step skipped (preceding hard failure / runner heuristic). |
Output / MCP Log Card (right)
Two sub-tabs:
-
Output — full agent stdout. Includes Claude reasoning chains, retry attempts, verifier diagnostics. Use ↓ Bottom to jump to the latest line.
-
MCP Log — every Playwright MCP call with arguments, colour-coded:
-
Blue: navigation (
browser_navigate,browser_navigate_back). -
Green: deterministic JS (
browser_run_code). -
Yellow: snapshot / wait_for.
-
Red: failures / retries.
Click a line to expand the JSON arguments. This is the single most useful tool for debugging "why did the click miss" / "what did the LLM see".
-
Force Stop
The Force Stop button (top-right of the runner card) hard-kills the
underlying Claude CLI subprocess and tears down the MCP connection for that
run. The case is marked error, not failed — useful for hung tests.
Force Stop is owner-scoped. POST /api/run/stop fans out to every worker as
the calling user, and each worker stops only that user’s run — it is a no-op on
runs you don’t own. Admins can stop any run. (The gateway resolves which worker
your run landed on, so a run on any worker is stoppable; the old "stops all
active runs everywhere" behaviour is gone.)
Batch Runs
When you tick more than one case in Tests, the whole batch is dispatched to a single worker and queued sequentially there (no parallelism within a batch — the cases share that worker’s Chromium and emulator, so concurrency would corrupt state).
-
The runner header shows a
pill-grayindicator like3/12for the current position in the queue. -
The full batch report is persisted under
/app/run-reports/batch-<id>.jsonon the worker and visible (owner-scoped) from the Dashboard dropdown.
To trigger a batch programmatically, post to the gateway with the chosen env
(model, dry_run and order are optional). Reuse the $TOKEN from the
login example:
curl -X POST http://ai.friendly-tech.com:8083/api/gateway/run/batch \
  -H "Authorization: Bearer $TOKEN" -H 'Content-Type: application/json' \
  -d '{
    "env":"qa65",
    "test_files":["C7677-network-score.yaml","C7722-de-mesh.yaml"],
    "model":"opus"
  }'
A 409 here means the env’s emulator is busy (see Selecting the Target Environment); 503
means no worker is free.
To poll batch status (gateway fans out owner-scoped to the worker running your batch):
curl -H "Authorization: Bearer $TOKEN" http://ai.friendly-tech.com:8083/api/run/batch
curl -H "Authorization: Bearer $TOKEN" http://ai.friendly-tech.com:8083/api/run/batch/report
To stop a batch (or any active run): hit Force Stop in the UI, or
POST /api/run/stop — it stops only your run (no-op on others'). See
Force Stop.
Live Browser (VNC)
Each worker runs Chromium inside Xvfb with x11vnc + noVNC. The noVNC stream is
now gateway-proxied and owner-gated — the old direct :6080/vnc.html host
port has been removed.
Click the Live Browser button in the header. The SPA calls
GET /api/live/stand, which returns the worker (stand) running your own active
run, then opens that worker’s noVNC through the gateway:
http://<gateway>/novnc/<stand>/vnc.html?path=novnc/<stand>/websockify?token=...
-
You must own an active run on that stand. The websockify WebSocket is owner-gated server-side: if you don’t own a running test there, the gateway closes the connection (
4403 "not your run"), so you can never watch another account’s session. -
With no running test of yours, the button reports there is nothing to view.
Useful when:
-
Debugging a failing step — watch what the agent actually sees.
-
Verifying tree-pushed state in the portal manually after a run.
-
Reproducing a flaky test interactively.
The VNC session is read-only-ish — you can click and type, but doing so will race with the running test and is generally a bad idea while a run is active.
| When no run is active the browser still has the last test’s session state. Clicking around won’t break anything, but you may need to log out before the next batch otherwise some tests skip the login step assuming the session is fresh. |
Inspecting Old Runs
GET /api/runs returns your recent runs (admins see all). The gateway merges
each worker’s in-memory ring buffer owner-scoped to the caller, sorted newest
first and capped at the most recent 200. Each entry has:
{
  "run_id":"...",
  "test_id":"C7677",
  "title":"...",
  "status":"passed|failed|error|running",
  "elapsed_ms":42031,
  "report":{ "status":"passed", "steps":[...] },
  "phase":"done"
}
For older runs, the JSON files under /app/run-reports/ survive container
restarts (mounted volume).