Network Topology Visualization
Overview
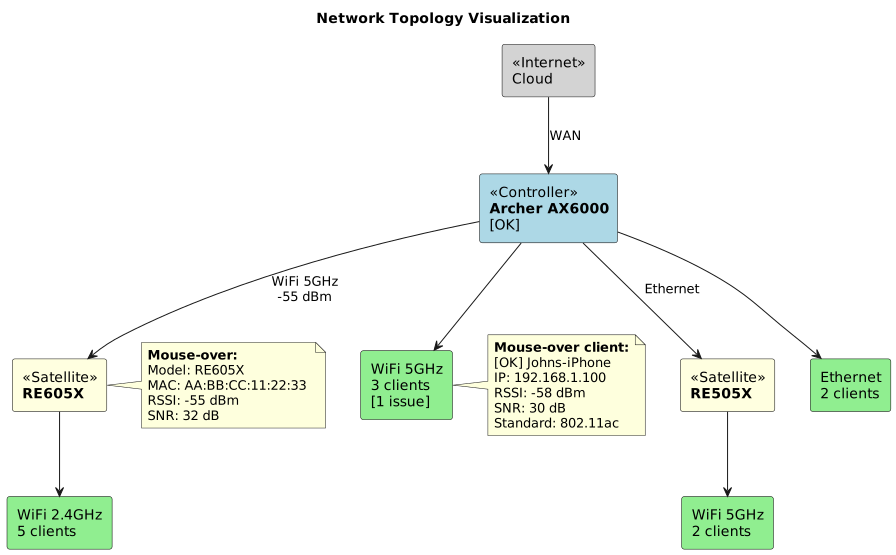
The Network Topology visualization represents the current customer network structure, displaying the mesh hierarchy, device relationships, connected clients, and connection health indicators.
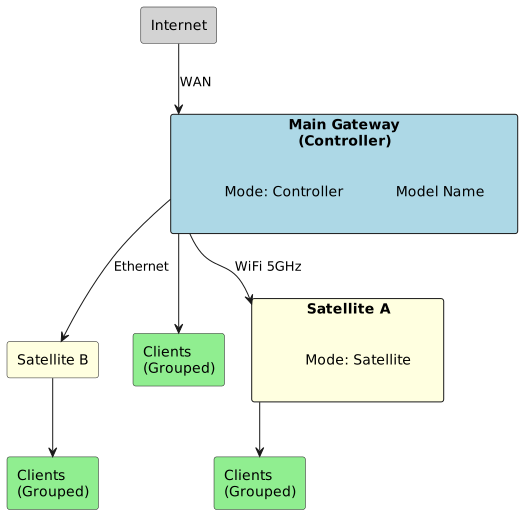
Main Gateway (Router/Controller)
Display Information
| Element | Condition | Display |
|---|---|---|
Model Name |
Always |
Device model name from |
Mode Label |
Mesh detected |
"Controller" |
Mode Label |
No mesh detected |
Not displayed (only Model Name shown) |
Internet Connection |
Always |
Visual indicator showing connection to Internet |
Status Icon |
No issues detected |
Green OK sign (checkmark) |
Status Icon |
WiFi issues detected |
Attention sign (warning triangle) |
Status Icon Logic
Green OK Sign - Display when: - No issues detected in Gateway WiFi Status monitoring - All WiFi bands operating normally - No critical alerts active
Attention Sign - Display when: - Any issue related to Gateway WiFi status detected - WiFi band(s) disabled or degraded - Channel interference detected - High error rates on WiFi interfaces
Satellites
Mouse-Over Information
When hovering over a Satellite device, display:
| Field | Source | Notes |
|---|---|---|
Model Name |
|
|
MAC Address |
Backhaul interface MAC address |
From mesh topology detection |
Backhaul RSSI |
SignalStrength parameter |
Only for WiFi backhaul; apply RCPI conversion if needed |
Backhaul SNR |
Calculated (DataElements only) |
Display "N/A" if Noise parameter absent |
Backhaul SNR Calculation (DataElements)
Backhaul SNR = Device.WiFi.DataElements.Network.Device.{i}.MultiAPDevice.Backhaul.Stats.SignalStrength
             - Device.WiFi.DataElements.Network.Device.{i}.Radio.{i}.Noise
Noise Value Handling:
If Noise is a positive value (RCPI format):
Noise [dBm] = Noise / 2 - 110Important: If "Noise" parameter is absent, display "N/A" for SNR field.
Click Information (Detailed View)
When clicking on a Satellite device, display detailed information:
| Field | Source | Notes |
|---|---|---|
Model Name |
|
|
MAC Address |
Backhaul interface MAC |
|
Backhaul RSSI |
SignalStrength |
Apply RCPI conversion if needed |
Backhaul PHY Rate |
|
From backhaul stats |
Link Utilization |
Calculated from traffic stats |
Percentage of capacity used |
Bytes Sent |
|
Total bytes transmitted |
Bytes Received |
|
Total bytes received |
Satellite Click View Parameter Paths
# DataElements Path
Device.WiFi.DataElements.Network.Device.{i}.MultiAPDevice.Backhaul.Stats.SignalStrength
Device.WiFi.DataElements.Network.Device.{i}.MultiAPDevice.Backhaul.Stats.LastDataDownlinkRate
Device.WiFi.DataElements.Network.Device.{i}.MultiAPDevice.Backhaul.Stats.LastDataUplinkRate
Device.WiFi.DataElements.Network.Device.{i}.MultiAPDevice.Backhaul.Stats.BytesSent
Device.WiFi.DataElements.Network.Device.{i}.MultiAPDevice.Backhaul.Stats.BytesReceived

# MultiAP Path
Device.WiFi.MultiAP.APDevice.{i}.BackhaulSignalStrength
Device.WiFi.MultiAP.APDevice.{i}.Backhaul.Stats.*
Connected Clients
Display Information
Clients are displayed grouped by their connection to each mesh device:
| Element | Display |
|---|---|
Client Count |
Number of clients connected to each device |
Grouping |
By connection (link) type |
Problem Indication |
Based on "Connected Client Health" score |
Grouping by Connection Type
Clients are grouped and displayed by their connection link type:
| Link Type | Display | Detection |
|---|---|---|
Ethernet |
"Ethernet" or Ethernet icon |
Layer1Interface contains |
WiFi with Band |
"WiFi 2.4 GHz", "WiFi 5 GHz", "WiFi 6 GHz" |
Layer1Interface contains |
Unknown |
"No information" or generic icon |
Cannot detect link type |
Problem Client Indication
Based on Client Health Score:
| Health Score | Indicator | Meaning |
|---|---|---|
70-100 |
OK (Green) |
No issues |
40-69 |
Warning (Yellow) |
Minor issues |
0-39 |
Attention (Red) |
Problems detected |
Mouse-Over Information
When hovering over a client or client group, display:
| Field | Source | Notes |
|---|---|---|
Status Icon |
Health score based |
OK or Attention sign |
Hostname |
|
|
IP Address |
|
|
RSSI |
|
"N/A" if not available (Ethernet clients) |
SNR |
|
"N/A" if not available |
Standard |
|
"N/A" if not available |
"N/A" Display Rules: - If parameter is not applicable (e.g., RSSI for Ethernet client) → Display "N/A" - If parameter is not available/empty → Display "N/A" - Never leave fields blank; always show "N/A" when no value
Connection Link Visualization
Implementation Example
Topology Data Structure
{
  "topology": {
    "controller": {
      "modelName": "Archer AX6000",
      "mode": "Controller",
      "macAddress": "00:11:22:33:44:55",
      "ipAddress": "192.168.1.1",
      "status": "ok",
      "internetConnected": true
    },
    "satellites": [
      {
        "modelName": "RE605X",
        "mode": "Satellite",
        "macAddress": "AA:BB:CC:11:22:33",
        "ipAddress": "192.168.1.2",
        "backhaul": {
          "type": "WiFi",
          "band": "5GHz",
          "parentMac": "00:11:22:33:44:55",
          "rssi": -55,
          "snr": 32,
          "phyRate": 866000,
          "bytesSent": 1234567890,
          "bytesReceived": 9876543210
        }
      }
    ],
    "clients": [
      {
        "connectedTo": "00:11:22:33:44:55",
        "connectionType": "WiFi",
        "band": "5GHz",
        "hostname": "Johns-iPhone",
        "ipAddress": "192.168.1.100",
        "macAddress": "11:22:33:44:55:66",
        "rssi": -58,
        "snr": 30,
        "standard": "802.11ac",
        "healthScore": 75,
        "status": "ok"
      }
    ]
  }
}
Display Logic Pseudocode
def render_topology(topology_data):
    # Render Controller/Gateway
    controller = topology_data.controller
    render_gateway(
        model=controller.modelName,
        mode="Controller" if topology_data.is_mesh else None,
        status_icon="ok" if controller.status == "ok" else "attention",
        internet_connected=controller.internetConnected
    )

    # Render Satellites
    for satellite in topology_data.satellites:
        render_satellite(
            model=satellite.modelName,
            mode="Satellite",
            backhaul=satellite.backhaul
        )

        # Draw connection line
        draw_connection(
            from_device=satellite.backhaul.parentMac,
            to_device=satellite.macAddress,
            type=satellite.backhaul.type,
            band=satellite.backhaul.band,
            signal_strength=satellite.backhaul.rssi
        )

    # Render Client Groups
    client_groups = group_clients_by_device_and_type(topology_data.clients)
    for device_mac, groups in client_groups.items():
        for connection_type, clients in groups.items():
            problem_count = count_problem_clients(clients)
            render_client_group(
                device=device_mac,
                connection_type=connection_type,
                count=len(clients),
                problem_count=problem_count
            )

def get_mouse_over_data(element_type, element_data):
    if element_type == "satellite":
        return {
            "modelName": element_data.modelName,
            "macAddress": element_data.backhaul.macAddress,
            "rssi": element_data.backhaul.rssi if element_data.backhaul.type == "WiFi" else "N/A",
            "snr": calculate_snr(element_data) or "N/A"
        }
    elif element_type == "client":
        return {
            "status": "ok" if element_data.healthScore >= 70 else "attention",
            "hostname": element_data.hostname,
            "ipAddress": element_data.ipAddress,
            "rssi": element_data.rssi or "N/A",
            "snr": element_data.snr or "N/A",
            "standard": element_data.standard or "N/A"
        }