Network Score Calculation
Purpose
The Network Score provides a comprehensive assessment of the overall network health by aggregating five Key Performance Indicators (KPIs). This score enables service providers to quickly identify network issues and prioritize support interventions.
The Network Score is displayed in the "Network Score Cube" dashboard widget, providing an at-a-glance view of:
-
Overall network health (0-100 scale)
-
Individual KPI status indicators
-
Problem area identification
Only applicable for TR-181 Data model + TR-369 further.
Score Distribution
| Score Range | Status | Color | Description |
|---|---|---|---|
61-100 |
Good |
Green |
Network performing well |
31-60 |
Average |
Yellow |
Minor issues detected; monitoring recommended |
1-30 |
Low |
Red |
Significant issues; action required |
Score definition can be changed during UI settings.
KPI Overview
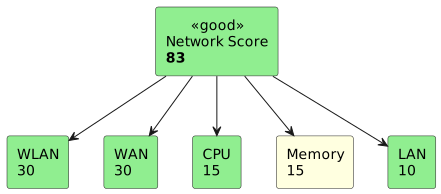
The Network Score is calculated from five weighted KPIs:
| KPI | Weight | Description |
|---|---|---|
KPI-WLAN |
30 |
WiFi network performance and interference |
KPI-WAN |
30 |
Internet connection quality and stability |
KPI-Memory |
15 |
Device memory utilization |
KPI-CPU |
15 |
Device processor utilization |
KPI-LAN |
10 |
Local network interface health |
Total |
100 |
Network Score Formula
Network Score = KPI_WLAN + KPI_WAN + KPI_Memory + KPI_CPU + KPI_LANWhere each KPI contributes its weighted score (maximum contribution equals its weight).
Weight of each Main KPI is decreased (if needed) by the same percentage of decreasing from its Value.
KPI-WLAN (WiFi Performance)
Weight: 30 points
KPI-WLAN measures WiFi performance across three sub-metrics:
| Sub-metric | Code | Description |
|---|---|---|
Total Hosts |
TH |
Per-host average of RSSI, SNR, and WiFi Standard scores |
Interference |
INT |
Co-channel interference, adjacent channel interference, and retransmission rates |
Number of Hosts |
NH |
Total number of connected wireless clients |
Total Hosts Score (TH)
Per-host WiFi quality metrics averaged across all connected hosts.
TH = RSSI + SNR + STD

RSSI = (33 × ((RSSI_1 + RSSI_2 + ... + RSSI_N) / N)) / 100
SNR  = (33 × ((SNR_1  + SNR_2  + ... + SNR_N)  / N)) / 100
STD  = (33 × ((STD_1  + STD_2  + ... + STD_N)  / N)) / 100
SNR is derived as: SNR = SignalStrength - Device.WiFi.Radio.{i}.Stats.Noise (range approximately -10 to -90 = 80)
|
Per-host scoring table (Total Hosts = 33% of WLAN):
| Parameter | Distribution (%) | Good (score 34/33) | Average (score 22) | Bad (score 11) |
|---|---|---|---|---|
RSSI |
34 |
-1 to -50 dBm |
-51 to -70 dBm |
-71 to -99 dBm |
SNR |
33 |
99 to 40 |
39 to 16 |
15 to -100 |
Standard |
33 |
AC, AX |
N (802.11n) |
B, G, A |
Per-host calculation:
| Per Host | Host 1 | Host 2 | Host 3 | Host N | Total |
|---|---|---|---|---|---|
RSSI |
KPI/1 |
KPI/2 |
KPI/3 |
KPI/N |
34 = 100% |
SNR |
KPI/1 |
KPI/2 |
KPI/3 |
KPI/N |
33 = 100% |
Standard |
KPI/1 |
KPI/2 |
KPI/3 |
KPI/N |
33 = 100% |
TR-181 Parameter Paths:
# RSSI
Device.WiFi.AccessPoint.{i}.AssociatedDevice.{i}.SignalStrength

# SNR (calculated)
SignalStrength - Device.WiFi.Radio.{i}.Stats.Noise

# Standard
Device.WiFi.AccessPoint.{i}.AssociatedDevice.{i}.OperatingStandard
Interference Score (INT)
Co-channel and adjacent channel interference plus retransmission rate.
INT = 34 × ((KPI_CO_CH + KPI_ADJ_CH + KPI_RETRANS) / 100)
RETRANSMISSION = (RetransCount × 100) / PacketsSent = %
Dual-band interference scoring (Interference = 34% of WLAN):
| Band | Distribution (%) | KPI | Good (score 13/12) | Average (score 6) | Bad (score 1) |
|---|---|---|---|---|---|
Wi-Fi Networks 2.4 G |
12 |
Co-Channel (networks with RSSI > -70) |
less than 2 (score 0-2) |
2 to 5 (score 3-5) |
more than 5 (score 6-99) |
Wi-Fi Networks 2.4 G |
13 |
Adjacent channel (-2/+2 channels from user’s with > -80 RSSI) |
less than 2 (score 0-2) |
2 to 5 (score 3-5) |
more than 5 (score 6-99) |
Wi-Fi Networks 5 G |
12 |
Co-Channel (networks with RSSI > -70) |
less than 2 (score 0-2) |
2 to 5 (score 3-5) |
more than 5 (score 6-99) |
Wi-Fi Networks 5 G |
13 |
Adjacent channel (-2/+2 with width >20MHz channels with > -80 RSSI) |
less than 2 (score 0-2) |
2 to 5 (score 3-5) |
more than 5 (score 6-99) |
Retransmission scoring:
| Band | Distribution (%) | Good (score 25) | Average (score 12) | Bad (score 1) |
|---|---|---|---|---|
Retransmission 2.4 G |
25 |
less than 5% |
5% to <10% |
more than 10% |
Retransmission 5 G |
25 |
less than 5% |
5% to 10% |
more than 10% |
Single-band variant (if only one band available):
| Distribution (%) | KPI | Good (score 34/33) | Average (score 22) | Bad (score 11) |
|---|---|---|---|---|
33 |
Co-Channel (networks with RSSI > -70) |
less than 2 (score 0-2) |
2 to 5 (score 3-5) |
more than 5 (score 6-99) |
34 |
Adjacent channel (-2/+2 channels with > -70 RSSI) |
less than 2 (score 0-2) |
2 to 5 (score 3-5) |
more than 5 (score 6-99) |
33 |
Retransmission |
less than 5% |
5% to 10% |
more than 10% |
TR-181 Parameter Paths:
# Interference
Device.WiFi.NeighboringWiFiDiagnostic.Result.{i}.Channel
Device.WiFi.NeighboringWiFiDiagnostic.Result.{i}.SignalStrength

# USP
Device.WiFi.Radio.{i}.FullScan()
Device.WiFi.Radio.{i}.FullScan().ScanResult.{i}.OpClassScan.{i}.ChannelScan.{i}.Channel
Device.WiFi.Radio.{i}.FullScan().ScanResult.{i}.OpClassScan.{i}.ChannelScan.{i}.NeighborBSS.{i}.SignalStrength

# Retransmission
Device.WiFi.SSID.{i}.Stats.RetransCount
Device.WiFi.SSID.{i}.Stats.PacketsSent
Number of Hosts Score (NH)
Total number of wireless clients connected to any band.
NH = 33 × (KPI / 100)| KPI | Distribution (%) | Good (score 100) | Average (score 66) | Bad (score 33) |
|---|---|---|---|---|
Number of hosts (any band) |
100 |
1-10 |
11-19 |
20-99 |
TR-181 Parameter Paths:
Device.WiFi.AccessPoint.{i}.AssociatedDeviceNumberOfEntriesKPI-WAN (Internet Connection)
Weight: 30 points
KPI-WAN measures WAN connection quality based on the active interface type. Only one WAN interface is active at a time.
WAN = 30 × ((KPI_1 + KPI_2 + KPI_3 + ... + KPI_N) / 100)WAN Interface Detection
Detect active WAN interface by checking Enable == true and Status == "Up". Upstream must be true for Ethernet WAN interfaces.
If more than 1 active interface, take first by priority: Ethernet → Optical → Cellular → DSL
Device.Ethernet.Interface.{i}.Enable, .Status, .Upstream (if true)
Device.Cellular.Interface.{i}.Enable, .Status
Device.Optical.Interface.{i}.Enable, .Status
Device.DSL.Line.{i}.Enable, .Status
Ethernet WAN
WAN Ethernet ports identified by Device.Ethernet.Interface.{i}.Upstream == true.
| Distribution (%) | KPI | Good (score 25) | Average (score 12) | Bad (score 1) |
|---|---|---|---|---|
25 |
Link Speed |
1000 Mbps |
100 Mbps |
10 Mbps |
25 |
Duplex |
Full (Auto) |
Half |
— |
25 |
Errors |
0 to 0.49% |
0.5 to 1% |
1.01 to 100% |
25 |
Discards |
0 to 0.49% |
0.5 to 1% |
1.01 to 100% |
TR-181 Parameter Paths:
# Link Speed
Device.Ethernet.Interface.{i}.CurrentBitRate

# Duplex
Device.Ethernet.Interface.{i}.DuplexMode

# Errors
Device.Ethernet.Interface.{i}.Stats.ErrorsSent + Device.Ethernet.Interface.{i}.Stats.ErrorsReceived

# Discards
Device.Ethernet.Interface.{i}.Stats.DiscardPacketsSent + Device.Ethernet.Interface.{i}.Stats.DiscardPacketsReceived
Fiber (Optical) WAN
| Distribution (%) | KPI | Good (score 34/33) | Average (score 22) | Bad (score 11) |
|---|---|---|---|---|
34 |
Optical Signal |
65 to -7 dBm |
-8 to -20 dBm |
-21 to -65 dBm |
— |
Transmit Optical |
Only show (values depend on Class A, B, C — class value cannot be queried) |
||
33 |
Errors |
0 to 0.49% |
0.5 to 1% |
1.01 to 100% |
33 |
Discards |
0 to 0.49% |
0.5 to 1% |
1.01 to 100% |
TR-181 Parameter Paths:
# Optical Signal
Device.Optical.Interface.{i}.OpticalSignalLevel

# Errors
Device.Optical.Interface.{i}.Stats.ErrorsSent + Device.Optical.Interface.{i}.Stats.ErrorsReceived

# Discards
Device.Optical.Interface.{i}.Stats.DiscardPacketsSent + Device.Optical.Interface.{i}.Stats.DiscardPacketsReceived
Cellular (Mobile) WAN — 4G/LTE
| Distribution (%) | KPI | Good (score 20) | Average (score 10) | Bad (score 1) |
|---|---|---|---|---|
20 |
RSSI |
more than -60 dBm |
-61 to -80 dBm |
-81 to -117 dBm |
20 |
RSRP |
more than -70 dBm |
-71 to -90 dBm |
-91 to -144 dBm |
20 |
RSRQ |
more than -10 dB |
-11 to -15 dB |
-16 to -20 dB |
20 |
Errors |
0 to 0.49% |
0.5 to 1% |
1.01 to 100% |
20 |
Discards |
0 to 0.49% |
0.5 to 1% |
1.01 to 100% |
Cellular (Mobile) WAN — 3G
| Distribution (%) | KPI | Good (score 34/33) | Average (score 22) | Bad (score 11) |
|---|---|---|---|---|
34 |
RSSI |
more than -60 dBm |
-61 to -86 dBm |
-86 to -117 dBm |
33 |
Errors |
0 to 0.49% |
0.5 to 1% |
1.01 to 100% |
33 |
Discards |
0 to 0.49% |
0.5 to 1% |
1.01 to 100% |
TR-181 Parameter Paths (Mobile):
# RSSI
Device.Cellular.Interface.{i}.RSSI

# RSRP
Device.Cellular.Interface.{i}.RSRP

# RSRQ
Device.Cellular.Interface.{i}.RSRQ

# Errors
Device.Cellular.Interface.{i}.Stats.ErrorsSent + Device.Cellular.Interface.{i}.Stats.ErrorsReceived

# Discards
Device.Cellular.Interface.{i}.Stats.DiscardPacketsSent + Device.Cellular.Interface.{i}.Stats.DiscardPacketsReceived
DSL WAN
| Distribution (%) | KPI | Good (score 25) | Average (score 12) | Bad (score 1) |
|---|---|---|---|---|
25 |
SNR (Noise Margin) |
more than 30 dB |
29 to 11 dB |
less than 10 dB |
25 |
Attenuation |
less than 20 dB |
21 to 45 dB |
more than 45 dB |
— |
Bit Rate (DL/UL) |
Show only, depends on xDSL technology |
||
25 |
Errors |
0 to 0.49% |
0.5 to 1% |
1.01 to 100% |
25 |
Discards |
0 to 0.49% |
0.5 to 1% |
1.01 to 100% |
TR-181 Parameter Paths (DSL):
# SNR
Device.DSL.Line.{i}.DownstreamNoiseMargin

# Attenuation
Device.DSL.Line.{i}.DownstreamAttenuation
# VDSL2: Device.DSL.Line.{i}.TestParams.SATNds

# Errors
Device.DSL.Line.{i}.Stats.ErrorsSent + Device.DSL.Line.{i}.Stats.ErrorsReceived

# Discards
Device.DSL.Line.{i}.Stats.DiscardPacketsSent + Device.DSL.Line.{i}.Stats.DiscardPacketsReceivedKPI-Memory (Memory Utilization)
KPI-LAN (Local Network)
Weight: 10 points
KPI-LAN measures the health of local Ethernet interfaces. LAN interfaces are identified by Device.Ethernet.Interface.{i}.Upstream == false.
LAN KPI is composed of four sub-metrics, calculated per port and then averaged:
LAN = 10 × ((LNK + DPL + ERR + DSC) / 100)

LNK = (LNK_1 + LNK_2 + ... + LNK_N) / N
DPL = (DPL_1 + DPL_2 + ... + DPL_N) / N
ERR = (ERR_1 + ERR_2 + ... + ERR_N) / N
DSC = (DSC_1 + DSC_2 + ... + DSC_N) / N

ERRORS/DISCARDS = (ERR(DIS) × 100) / PACKETS_SENT(REC) = %
LAN Thresholds
| Distribution (%) | KPI | Good (score 25) | Average (score 12) | Bad (score 1) |
|---|---|---|---|---|
25 |
Link Speed |
1000 Mbps |
100 Mbps |
10 Mbps |
25 |
Duplex |
Full (Auto) |
Half |
— |
25 |
Errors |
0 to 0.49% |
0.5 to 1% |
1.01 to 100% |
25 |
Discards |
0 to 0.49% |
0.5 to 1% |
1.01 to 100% |
Per-port calculation:
| Per Port | Port 1 | Port 2 | Port N | Total |
|---|---|---|---|---|
Link Speed |
KPI/1 |
KPI/2 |
KPI/N |
25 = 100% |
Duplex |
KPI/1 |
KPI/2 |
KPI/N |
25 = 100% |
Errors |
KPI/1 |
KPI/2 |
KPI/N |
25 = 100% |
Discards |
KPI/1 |
KPI/2 |
KPI/N |
25 = 100% |
TR-181 Parameter Paths:
# Link Speed
Device.Ethernet.Interface.{i}.CurrentBitRate

# Duplex
Device.Ethernet.Interface.{i}.DuplexMode

# Errors
Device.Ethernet.Interface.{i}.Stats.ErrorsSent + Device.Ethernet.Interface.{i}.Stats.ErrorsReceived

# Discards
Device.Ethernet.Interface.{i}.Stats.DiscardPacketsSent + Device.Ethernet.Interface.{i}.Stats.DiscardPacketsReceived
Missing Data Handling
When KPI data is unavailable:
-
KPI Weight Redistribution: Redistribute the missing KPI’s weight proportionally to available KPIs
-
Minimum KPIs Required: At least 3 KPIs must be available for a valid Network Score (.NET UI). Angular UI uses alternative flow: display "Not enough parameters"
-
Insufficient Data: Display "Not enough parameters" if fewer than 3 KPIs are available
Related Documentation
-
Client Health Score - Individual client health calculation
-
Internet Connectivity - WAN interface detection and parameters
-
Architecture - System overview and data flow