FT Device Network Service Separate Host Deployment
Overview
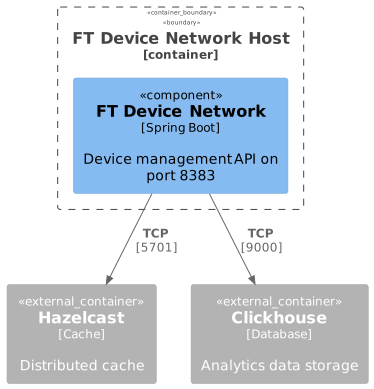
This deployment runs FT Device Network Service on a dedicated host. This is a Spring Boot microservice that provides WiFi device management and network configuration capabilities.
Prerequisites
|
For detailed information about Docker registry and image management, see Docker Image Management Guide. |
Preparation
2. Prepare Environment File
cp .env.template .envOr create .env file with the following content:
# Service specific vars
FT_DEVICE_NETWORK_HTTP_PORT=8383
FT_DEVICE_NETWORK_JAVA_RAM=-Xms256m -Xmx1g
FT_DEVICE_NETWORK_LOG_LEVEL=info

# Common vars
DATA_FOLDER=/usr/local/ft-services
HZ_MEMBERS=~HAZEL_HOST~:5701
TZ=Europe/Kiev

# Clickhouse
CLICKHOUSE_HOST=~CLICKHOUSE_HOST~
CLICKHOUSE_HTTP_PORT=8123
CLICKHOUSE_DATABASE=ftacs_qoe_ui_data
CLICKHOUSE_USERNAME=ftacs
CLICKHOUSE_PASSWORD=ftacs
3. Configure Host Variables
Edit .env and replace placeholder values:
# Required replacements:
~HAZEL_HOST~      → Hazelcast server (e.g., 192.168.1.50)
~CLICKHOUSE_HOST~ → Clickhouse server (e.g., 192.168.1.70)
Example configuration:
HZ_MEMBERS=192.168.1.50:5701,192.168.1.51:5701,192.168.1.52:5701
CLICKHOUSE_HOST=192.168.1.70Container Startup Process
The service starts with the following initialization sequence:
-
JVM Initialization
-
Loads JVM settings from
JAVA_OPTSenvironment variable -
Memory allocation: 256MB initial, 1GB maximum (configurable)
-
G1 garbage collector enabled for optimized performance
-
Heap dump on OutOfMemoryError for troubleshooting
-
-
Application Startup
-
Initializes Spring Boot application
-
Connects to Hazelcast cluster for distributed caching
-
Connects to Clickhouse for analytics data storage
-
Registers REST API endpoints
-
-
Health Check
-
Actuator health endpoint becomes available at
/api/actuator/health -
Service is marked as healthy after successful startup
-
Health check runs every 30 seconds
-
Environment Variables
Service Configuration
| Variable | Description | Default | Required |
|---|---|---|---|
|
Service HTTP port (external) |
|
Yes |
|
JVM memory settings (min and max heap) |
|
No |
|
Application log level (trace, debug, info, warn, error) |
|
No |
Common Configuration
| Variable | Description | Default | Required |
|---|---|---|---|
|
Base directory for persistent data |
|
Yes |
|
Timezone for the service |
|
Yes |
External Dependencies
| Variable | Description | Default | Required |
|---|---|---|---|
|
Hazelcast cluster members (comma-separated HOST:PORT) |
|
Yes |
|
Clickhouse server address |
|
Yes |
|
Clickhouse port |
|
Yes |
|
Clickhouse database name |
|
Yes |
|
Clickhouse username |
|
Yes |
|
Clickhouse password |
|
Yes |
JVM Configuration Details
The JAVA_OPTS environment variable includes:
| Option | Description | Purpose |
|---|---|---|
|
Initial heap size |
Starting memory allocation |
|
Maximum heap size |
Memory limit (configurable via |
|
JVM timezone |
Ensures correct timestamp handling |
|
G1 garbage collector |
Modern GC for better performance |
|
String deduplication |
Reduces memory usage for duplicate strings |
|
Heap dump on OOM |
Creates dump file for troubleshooting |
|
Heap dump location |
Stored in logs directory |
Service Access
After successful deployment:
| Endpoint | URL | Description |
|---|---|---|
Health Check |
Service health status |
|
Actuator Info |
Service information |
|
API Documentation |
Swagger UI (if enabled) |
Exposed Ports
| Port | Service | Protocol | Purpose | Configurable Via |
|---|---|---|---|---|
8383 |
FT Device Network |
HTTP |
REST API |
|
Verify port is listening:
netstat -tlnp | grep 8383
# or
ss -tlnp | grep 8383
Test service health:
curl http://localhost:8383/api/actuator/healthExpected response:
{
  "status": "UP"
}
Data Persistence
Persistent data location (assuming DATA_FOLDER=/usr/local/ft-services):
| Path | Content | Backup Required |
|---|---|---|
|
Application logs and heap dumps |
No (unless debugging needed) |
Folder structure:
/usr/local/ft-services/
└── ft-data/
    └── ft-device-network/
        └── logs/
            ├── application.log
            ├── spring.log
            └── heapdump.hprof (if OOM occurred)
Troubleshooting
Check Service Logs
# Via Docker Compose
docker compose logs -f

# Or direct file access
tail -f /usr/local/ft-services/ft-data/ft-device-network/logs/application.log
Common Issues
Service Not Starting
Check logs for errors:
docker compose logs ft-device-network-serviceCommon causes:
-
Port already in use:
-
Change
FT_DEVICE_NETWORK_HTTP_PORTin.env -
Or find and stop the conflicting process
-
-
Insufficient memory:
-
Reduce
FT_DEVICE_NETWORK_JAVA_RAMvalues -
Or allocate more RAM to Docker
-
Cannot Connect to Hazelcast
Symptom: Logs show Hazelcast connection timeouts or errors.
Check connectivity:
# Test Hazelcast reachability
telnet <HAZELCAST_HOST> 5701

# Check HZ_MEMBERS configuration
docker compose exec ft-device-network-service env | grep HZ_MEMBERS
Solution:
- Verify HZ_MEMBERS addresses are correct in .env
- Ensure Hazelcast cluster is running and accessible
- Check firewall rules allow port 5701
Cannot Connect to Clickhouse
Symptom: Logs show Clickhouse connection errors.
Check connectivity:
# Test Clickhouse reachability
telnet <CLICKHOUSE_HOST> 9000

# Check Clickhouse configuration
docker compose exec ft-device-network-service env | grep CLICKHOUSE
Solution:
- Verify CLICKHOUSE_HOST is correct in .env
- Ensure Clickhouse is running and accessible
- Verify credentials (CLICKHOUSE_USERNAME, CLICKHOUSE_PASSWORD)
- Check database exists: CLICKHOUSE_DATABASE=ftacs_qoe_ui_data
Health Check Failing
Check health endpoint directly:
curl -v http://localhost:8383/api/actuator/healthIf endpoint returns 503 or error: - Wait for application to fully initialize (can take 30-40 seconds) - Check logs for startup errors - Verify external dependencies (Hazelcast, Clickhouse) are accessible
OutOfMemoryError
Symptom: Service crashes with OOM error.
Check heap dump:
ls -lh /usr/local/ft-services/ft-data/ft-device-network/logs/heapdump.hprofSolution: 1. Increase memory allocation:
FT_DEVICE_NETWORK_JAVA_RAM=-Xms512m -Xmx2g-
Restart service:
docker compose restart-
If issue persists, analyze heap dump or contact support
Debugging
Enable Debug Logging
Edit .env:
FT_DEVICE_NETWORK_LOG_LEVEL=debugRestart service:
docker compose restartIncrease JVM Memory
For high-load environments, increase memory allocation:
FT_DEVICE_NETWORK_JAVA_RAM=-Xms512m -Xmx2gMonitor Resource Usage
# Real-time container stats
docker stats ft-device-network-service

# Check heap usage via JMX (if exposed)
curl http://localhost:8383/api/actuator/metrics/jvm.memory.usedMaintenance
Update Service
# Pull latest image
docker compose pull

# Restart with new image
docker compose up -d
Force Repull Image
docker compose down
docker compose pull --ignore-pull-failures
docker compose up -d
Backup Logs
# Backup logs directory
tar -czf ft-device-network-logs-$(date +%Y%m%d).tar.gz \
  /usr/local/ft-services/ft-data/ft-device-network/logs/

# Optional: Compress old logs
cd /usr/local/ft-services/ft-data/ft-device-network/logs/
gzip application.log.* spring.log.*Performance Tuning
Adjust Memory Based on Load
Monitor memory usage and adjust accordingly:
| Load Level | Recommended Setting | Use Case |
|---|---|---|
Low |
|
Small deployments, <100 devices |
Medium |
|
Standard deployments, 100-1000 devices |
High |
|
Large deployments, 1000+ devices |
Very High |
|
Enterprise deployments, high concurrency |